9/6/15 00:07 am: @hunter2 Full disclosure, I'm not options expert, I just do what works. Please consider #OMM. I'm told that the conversations in #OMM are much more in line with serious trading.
Getting back to our discussion.
Stay with the "non-leveraged" ETFs, even if doing it with paper money. I'm most familiar with $SPY and $IWM. You seem to like $QQQ. I used to trade the options on $TNA, it's become a VERY crowded trade. I do best when I have "space." Besides, this "wedge" formation makes "sitting on your credit spreads, i.e. gaining on "theta burn,"" a much better proposition. ESPECIALLY when the VIX is high. Wedge and triangles love to take your money by stopping you out (below the wedge) and enticing you in (just above the "false breakout" upper border of the triangle).
...... think about it. http://tinyurl.com/wedge-is-pac-man
( BTW: The link was made on 8/24/15; I'm just using my experience of patterns that have hurt traders over the years). No I was not predicting, just citing high probability scenarios.
Remember the saying when the VIX is high, it's time to buy? Well, selling premium could be looked on as "buying(bups)."
Caveat:
* Use a modified DAN's 3 day rule when doing a bups, i.e. enter NO earlier than day 2 of selling.
* And to balance oneself on the spike up; sell a deep OTM becs. Once again use DAN's 3 day rule enter your becs no earlier than day 2 of heavy market upside.
What's worked NICELY for me , is keeping my delta close to neutral. http://tinyurl.com/basic-delta-neutral . And until the market chooses a trend, I'll stay with this strategy.
I rarely INITIATE an advanced option strategy, e.g. Iron Condors, "flys" ratio spreads, broken wing butterflys, etc. As an example, I initiate simple bups, then on spikes up becs, that "morphs" into Iron Condors. The "morphing" results in an Iron Condor, but not as the initial entry. The "advanced option position" came as a "corollary goal" of attaining "delta neutral."
Or when the VIX and IV% is low, I flip to a different strategy, i.e. initiate with beps, bucs and straight calls & puts. (Caveat: Also heavily dependent on the instruments IV%). .
REMEMBER: When the VIX is high, LONG OPTIONS are VERY expensive. So for the most part, long options is high probability losing money. Selling options IMO is a more lucrative strategy.
....... trend is your friend... and right now the trend is south.
So perhaps on drops, consider DTE >30 bups at <18 delta, perhaps 3-10 strikes wide. Try this in your paper money account. Over a period of years you'll find how much you will make. BTW, I visited my paper money account, which I hadn't visited in two years, I had bought $AMZN $TNA and $GOOG at 100 share lots and it nearly tripled in price.***
*******************side discussion on the sit concept************
(***So this supports DAN's thesis on sitting on holdings, given:
1) Advantageous trade location: i.e. you are entering in a the proper climate (back then it was bullish with QE), then just sit on it.
2) Advantageous yearly time cycle; remember most of an investor's gains occur between the months of mid-October to February. The chop months, March to October are the "meh!...."
Imagine if I were an activist manager (which I am) in that paper money/or better yet real money account, selling calls on peaks, then selling put spreads on drops to ADD to the gains on the stocks and ETFs. Imagine if I bot calls with MUCH time premium on drops? Actually, I do have bids on calls based on calculations for $SPY Jan16 OTM calls, projecting Delta28 Calls to being MUCH less..... these won't be answered until the next big spike down.... if that happens. Then, if the market elevates, I'll roll a few of these calls up north (when and if it gets profitable... it will) and hold a few down to "couple later as a "becs."
*******************end of side discussion on the sit concept************
Getting back to options:
Look at the $SPY Jan 16 200 Strike (38delta), Open Interest of 33,864 (if this is all new to you, jot it down in your notes, "it will make sense later." A few of the o/i are primarily "unfilled bids," will it fill? It might. Some of the bids are absolutely low ballers.........(oops such as mine's lol....). So that's part of my method.... I also do it for the put side also on market spikes up when the VIX is low. Believe me, your best advisor is sometimes your own holdings in your portfolio... (another little tidbit on why my market calls are "sometimes," spot on).
Remember when in doubt.........
1) journal;
2) ask questions; think about it;
3) journal more.
Amazing what great insights comes on at the "most unusual times." My best insights come in early mornings when the "mind's clear and refreshed." Have a journal at the night stand. I keep my Moleskine note books all over the place.
****************************referenced note************************************
@hunter2: (9/4/15): "#Option_Spreads - me likee. I need to get on this stuff...."
9/5/15: @hunter2: Then perhaps, consider doing the credit spreads in your paper money account.
Ask questions, there are individuals who'll answer 'em. I do the simplest of $SPY $IWM credit spreads (bups & becs) .... and well diagonals.
I think Dan & Gary have a trial OMM membership, if I were you I'd look into the trial. I'm sure it'll help.
Just to get you thinking along these lines... http://www.theoptionsguide.com/credit-spread.aspx
Remember if you do credit spreads well, many of the spreads pay you and it may expire worthless.
http://www.optiontradingpedia.com/options_credit_spreads.htm
http://www.optiontradingpedia.com/free_deep_itm_bull_put_spread.htm
http://www.optiontradingpedia.com/free_bear_call_spread.htm
Markets spend more time going sideways than up or down.
9/4/15: @Prazan: This note will disappear magically, click on the graphic when its there ;-)
The Post Market and Premarket Tells.
Generally, the RTH stats from the Position Statement is more harmful than helpful (gets one to focus on profits vs. trading well). However, in the pre-and post market. The Rising and Falling Delta has been a "solid Confirmation" for me.
Also, the /DX (US Dollar
Has been another "tell"
for me. Oddly, when the
/DX has been up, so has
the US Equities.
Delta at 5:00 PM EST
Thursday 9/3/15
Delta at 5:45 AM EST
Friday, 9/4/15 (Pre-Labor Day)
9/2/15: Sorry guys & ladies... I meant to get this in before market close.
************************
Message: Wednesday is when many of the market makers will price in their delta/IV% today, tomorrow at the latest for the upcoming three day weekend coming up(journal entry for the past decade).
So today was the day to sell premium (I sold call spreads... traded in becs for my insurance beps).....
Three day weekend... theta burn!
I was surprised that the VIX dropped so much, going into a three day weekend..... odd.
Sorry! :-(
************************
9/1/15: IMO the best method lately:
Sell premium. Go VERY low in delta,
Algorithms seem to be targeting >21 Delta (for DTE: 21 to 28). Also check the O/I and options volume.
Getting back to our discussion.
Stay with the "non-leveraged" ETFs, even if doing it with paper money. I'm most familiar with $SPY and $IWM. You seem to like $QQQ. I used to trade the options on $TNA, it's become a VERY crowded trade. I do best when I have "space." Besides, this "wedge" formation makes "sitting on your credit spreads, i.e. gaining on "theta burn,"" a much better proposition. ESPECIALLY when the VIX is high. Wedge and triangles love to take your money by stopping you out (below the wedge) and enticing you in (just above the "false breakout" upper border of the triangle).
...... think about it. http://tinyurl.com/wedge-is-pac-man
( BTW: The link was made on 8/24/15; I'm just using my experience of patterns that have hurt traders over the years). No I was not predicting, just citing high probability scenarios.
Remember the saying when the VIX is high, it's time to buy? Well, selling premium could be looked on as "buying(bups)."
Caveat:
* Use a modified DAN's 3 day rule when doing a bups, i.e. enter NO earlier than day 2 of selling.
* And to balance oneself on the spike up; sell a deep OTM becs. Once again use DAN's 3 day rule enter your becs no earlier than day 2 of heavy market upside.
What's worked NICELY for me , is keeping my delta close to neutral. http://tinyurl.com/basic-delta-neutral . And until the market chooses a trend, I'll stay with this strategy.
I rarely INITIATE an advanced option strategy, e.g. Iron Condors, "flys" ratio spreads, broken wing butterflys, etc. As an example, I initiate simple bups, then on spikes up becs, that "morphs" into Iron Condors. The "morphing" results in an Iron Condor, but not as the initial entry. The "advanced option position" came as a "corollary goal" of attaining "delta neutral."
Or when the VIX and IV% is low, I flip to a different strategy, i.e. initiate with beps, bucs and straight calls & puts. (Caveat: Also heavily dependent on the instruments IV%). .
REMEMBER: When the VIX is high, LONG OPTIONS are VERY expensive. So for the most part, long options is high probability losing money. Selling options IMO is a more lucrative strategy.
....... trend is your friend... and right now the trend is south.
So perhaps on drops, consider DTE >30 bups at <18 delta, perhaps 3-10 strikes wide. Try this in your paper money account. Over a period of years you'll find how much you will make. BTW, I visited my paper money account, which I hadn't visited in two years, I had bought $AMZN $TNA and $GOOG at 100 share lots and it nearly tripled in price.***
*******************side discussion on the sit concept************
(***So this supports DAN's thesis on sitting on holdings, given:
1) Advantageous trade location: i.e. you are entering in a the proper climate (back then it was bullish with QE), then just sit on it.
2) Advantageous yearly time cycle; remember most of an investor's gains occur between the months of mid-October to February. The chop months, March to October are the "meh!...."
Imagine if I were an activist manager (which I am) in that paper money/or better yet real money account, selling calls on peaks, then selling put spreads on drops to ADD to the gains on the stocks and ETFs. Imagine if I bot calls with MUCH time premium on drops? Actually, I do have bids on calls based on calculations for $SPY Jan16 OTM calls, projecting Delta28 Calls to being MUCH less..... these won't be answered until the next big spike down.... if that happens. Then, if the market elevates, I'll roll a few of these calls up north (when and if it gets profitable... it will) and hold a few down to "couple later as a "becs."
*******************end of side discussion on the sit concept************
Getting back to options:
Look at the $SPY Jan 16 200 Strike (38delta), Open Interest of 33,864 (if this is all new to you, jot it down in your notes, "it will make sense later." A few of the o/i are primarily "unfilled bids," will it fill? It might. Some of the bids are absolutely low ballers.........(oops such as mine's lol....). So that's part of my method.... I also do it for the put side also on market spikes up when the VIX is low. Believe me, your best advisor is sometimes your own holdings in your portfolio... (another little tidbit on why my market calls are "sometimes," spot on).
Remember when in doubt.........
1) journal;
2) ask questions; think about it;
3) journal more.
Amazing what great insights comes on at the "most unusual times." My best insights come in early mornings when the "mind's clear and refreshed." Have a journal at the night stand. I keep my Moleskine note books all over the place.
****************************referenced note************************************
@hunter2: (9/4/15): "#Option_Spreads - me likee. I need to get on this stuff...."
- 06:06 AM 09/06
9/5/15: @hunter2: Then perhaps, consider doing the credit spreads in your paper money account.
Ask questions, there are individuals who'll answer 'em. I do the simplest of $SPY $IWM credit spreads (bups & becs) .... and well diagonals.
I think Dan & Gary have a trial OMM membership, if I were you I'd look into the trial. I'm sure it'll help.
Just to get you thinking along these lines... http://www.theoptionsguide.com/credit-spread.aspx
Remember if you do credit spreads well, many of the spreads pay you and it may expire worthless.
http://www.optiontradingpedia.com/options_credit_spreads.htm
http://www.optiontradingpedia.com/free_deep_itm_bull_put_spread.htm
http://www.optiontradingpedia.com/free_bear_call_spread.htm
Markets spend more time going sideways than up or down.
- 01:52 PM 09/05
9/4/15: @Prazan: This note will disappear magically, click on the graphic when its there ;-)
The Post Market and Premarket Tells.
Generally, the RTH stats from the Position Statement is more harmful than helpful (gets one to focus on profits vs. trading well). However, in the pre-and post market. The Rising and Falling Delta has been a "solid Confirmation" for me.
Also, the /DX (US Dollar
Has been another "tell"
for me. Oddly, when the
/DX has been up, so has
the US Equities.
Delta at 5:00 PM EST
Thursday 9/3/15
Delta at 5:45 AM EST
Friday, 9/4/15 (Pre-Labor Day)
- 06:52 AM 09/04
9/2/15: Sorry guys & ladies... I meant to get this in before market close.
************************
Message: Wednesday is when many of the market makers will price in their delta/IV% today, tomorrow at the latest for the upcoming three day weekend coming up(journal entry for the past decade).
So today was the day to sell premium (I sold call spreads... traded in becs for my insurance beps).....
Three day weekend... theta burn!
I was surprised that the VIX dropped so much, going into a three day weekend..... odd.
Sorry! :-(
************************
9/1/15: IMO the best method lately:
Sell premium. Go VERY low in delta,
Algorithms seem to be targeting >21 Delta (for DTE: 21 to 28). Also check the O/I and options volume.
8/29/15: @thermos: There are five different NH-NL data that I sum as a group. You have access to real time in TOS. Go with real time. $NYHGH-$NYLOW. They all follow a similar trend.
8/29/15: Amritsari: Your chart is misleading, I keep **[DETAILED records of PCR, and the BROADEST measures of NH-NL](http://tinyurl.com/monday-0824-nhl-spike).** *(See my note that preceded your's)*. I began scaling into my SPY calls off Tuesday lows.
A reason why I choose to use a cumulative value vs. simply looking at charts, is just for that reason as demonstrated by the chart you had posted, i.e. a few charts do not always tell the full story.
[Look at my spreadsheet table, **SUM NHL**](http://i.imgur.com/94Llnmq.jpg). My broad measures of NH-NL drop came NOT on Tuesday as you'd and indicated by your given chart, but on Monday, August 24, 2015.
I have written several notes for some time on **[PCR](http://stockbee.biz/search/?query=+PCR+&query=CBOE+PCR)**. and the various measures of NH-NL.
8/27/15: @Shackleton You're welcome. Those are the books newbies should read, if you are interested in swing trading. A few of the books addresses the concept of: "mindfulness."
**************Comments on Signals**********
Along with my relatively new benchmark (2 yrs old) http://tinyurl.com/nhl-summation, I have one that I've had for the past 10 years; another proprietary study http://tinyurl.com/25pcupmonth-lt200.
The last time I'd seen these numbers were September and October 2011. Back then I didn't enact on the signal. http://tinyurl.com/25pcupmonth-lt200 This time I acted with conviction and I shared it in our Forum, when others were being overly cautious and I needed to remain calm. These signals do not come often. http://i.imgur.com/EUOJVkw.jpg
And one won't hear it being surrounded by noise or #CHATTER, which is why I avoided the Forum the past several days. However, yesterday, on the day of the rebound I returned to the Forum to share the "signal."
Whoever listened: :-) whoever didn't you are NOT late.
Remember distractions cost you more money than you think. Remember I gave exit signals on 8/18/15. I was pretty sure there was something going on. http://i.imgur.com/VvC8Mq3.jpg
8/26/15 17:08 PM: @russ1030 Read my 10:11 PM post. I've studied this IBD phenomena for years. Nah not enough to keep me as a subscriber, which I stopped about eight years ago.
On Friday, August 21, 2015 earlier in the market day, the market was reeling; however, IBD added fuel to the fire. The ones that got the early message kept the selling going to the close. Then the weekend brought more IBD sellers on the following trading day on Monday morning 8/24/15.
IBD by their LARGE NUMBERS skew the craziness in favor of increased bearish action. And this action is transient, that reverses in a day or so. One might dispute my contention... that's ok; I've studied this enough to know otherwise.
I've studied and documented this IBD phenomena for years. And check my notes on this benchmark. Serendipitous? Coincidence? Er...no... sheer numbers like how "Cramerica" used to do the same; except IBD has a MUCH LARGER following. http://tinyurl.com/comments-IBD-MKT-status-chg
Yeah perhaps a one to two day phenomena; regardless however, an impact and reaction. And it adds "confusion" and uncertainty in a precarious scenario.
Remember: the greatest emotion in the market is: FEAR! Greed is a distant second.
08-18-15 Tue: The portfolio went from $1,054 to 994; because volatility is climbing. VIX is up to $13.92.
8/17/15:
Just scanning: A stock that came on my scan, that I have no clue on other than its breakout is $IPHI. Stock closed weak in the 2nd half of today.
Enclosed are the 1/2 day and the day chart.
[Edit]: Just noticed this (sorry I'm doing this "on the fly"), the close today is $24.99; the stock wants to "fill the gap to $26.00."
BTW: There is no #SMM history on this stock. Just searched it.
Newbies: Gaps often fills, it may be soon, days, weeks or months. Be cognizant of gaps.
Keep these on your radar for breakouts soon: $TMUS $NFLX $AMGN(below 8 EMA).
$TMUS today was a bullish doji decision (off Friday's doji)
$NFLX today broke and closed above strong resistance (161.8% Fibonacci). Today it's a bullish engulfment. If it opens positive tomorrow that is confirmation of the bullish engulfment; then watch the bears exit their bearish positions pronto.
$AMGN: See my earlier note with extensive chart notes.
Finally, one that I avoid because I'm never in sync with it: $NUS. That is a triangle pattern, much like the $SPY (see @GreenGhost's and my notes on it... click onto $SPY. Ghost was on this $SPY pattern from LAST WEEK!).
Getting back to $NUS, today it closed above both the 8 EMA and 50 SMA. Closed just below the daily pivot point (i.e. between R1 and S1).
I have positions in $NFLX and $AMGN. NP $TMUS and $NUS.
@justinp $SAVE looks VERY bullish. Check that weekly chart. Last two weeks with the indecisive spinning top dojis. Today's solid open & close makes a convincing statement. Today, $SAVE also closed above the 50 SMA.
I've noticed a few instances of gap closes above the 50 SMA. Big money is capable of moving the stocks as such; besides short covering and the absence of sellers. Three days ago that long tail doji defined the low at 58.25.
The airlines are definitely moving. Click on $JBLU, a few of us discussed it over the weekend. I'm just curious. Does $SAVE have routes near the Southeastern US? Possible #CUBA play.
$BPNYA report: This is the first time since July 16, 2015, that the $BPNYA closed ABOVE its 8 EMA. How many more confirmations does one need?
http://tinyurl.com/bpnya-20150817-monday
(fixed)
Seriously, however, on July 17, 2015 the $BPNYA went below the 8 EMA.
What's the difference between this time and July 16/17?
Same ol' THESIS of mine's. Big money IS behind this current move. It's documented. Back on July 16 & 17, the ES 11 am futures were BELOW .500 mil.
Last Wednesday, it EXCEEDED one million. See the right side of the chart.
8/11/15: Posts that were deleted:
@Jorma Nice trade on the $TLT. It should have a very nice day come Wednesday. Both /ZB (Bond Futures) & /ZN (Treasury Notes) are up 0.65% and 0.38% respectively. ONite traders are selling the indices and buying the bonds and notes.
The PCR spiked at the EOD to 1.10 from 0.56 the previous day. The next two days will have a wide range of price swings.
Enclosure: My model for trades the past week. Devised from past Friday.
Current Status: "Middle "chop zone,"" where many bad trades occur. Best trades for me are my index short calls. Another day of downside bias? Whoosh down day tomorrow? I do have the 67 Delta Sep2 $SPY puts that'll fatten up with the increasing vol.
And notice how the LARGE spikes, >135 on the magenta SKEW chart, PRECEDES the eventual spikes on the TAN colored -SPY price line.
**********referenced note***************************************
@janner0814: "4:37 PM 08/11/15:Options SKEW vs. Negative SPY (I've "negativized" the SPY chart in order to facilitate viewing of the correlation to SKEW).
We are volatile, however, it's the 135 level that gets pros to close out longs.
[Edit: Fixed. The 135 level is the top pink line]
http://www.investopedia.com/terms/v/volatility-skew.asp "
....
Wondered why portfolio began moving north. It turns out $GOOGL moving to $700 (again in the after hours).
....Catching up on my reading. Mentioned by @FHS EID, IBD http://tinyurl.com/ibd-yuan-devalued Here's a picture of the us dollar: yuan graph. Whoever's in China right now, is getting a nice exchange rate.
....Compelling doji for $WFC at the lower BB. Tomorrow's open and close will give a "tell" whether $WFC is a short or a buy.
On Monday(yesterday), $WFC closed above the 8 EMA; however, today it closed below it. Indecisive action.
Look at the last time $WFC tested & breached the lower BB on 7/6/15 ("rectangled left"). I'm not suggesting that will happen; however. tomorrow's price action becomes crucial and telling.
- 06:59 PM 08/11
08-11-15 Tue 05:59 AM: IMO, the VIX wants to climb another two more days.
08-11-15 Tue 04:51 AM: @hunter2 As you know being a T/A, short term traders are pushing retail traders to liquidate. Then they buy at certain technical levels. I used the 1m,5m,10m,15m rule of the "takeout," i.e. watched if the market biggies wanted to take out the lows of the given time frame.
The VIX ($VXX) confirmed the down move; which is a confounding divergence. Apparently the algos are now onto traders who are using the VIX as a confirming benchmark.
Today, I am bullish for today.
08-09-15 Sun: Heads up!. Hey guys just be careful of the Airlines. Consider these observations: $SKYW log: Double doji, the next candle is critical. Still well above the 8 EMA.
Bearish:
1) $AAL: Confirmed bearish engulfing pattern. On Friday, it closed below the 8 EMA
Indecisive, still bullish:
2) $DAL: Failed Bearish doji decision; could go north. Still above the 8 EMA
3) $LUV: Triple dojis; drifting lower. Getting closer to the 8 EMA
8/7/15: @issues $NVDA = double thumbs up. Great call as always @issues! You dah man. Yeah I'm drinking rum! I also sold some BUPS on $IBB Sep1 345x271 bups for $3.85 credit; gives me 10c credit per day x 3 to Monday; c@ $3.75.
$TREE $FIX $FIT
If you like $TREE, then you might also like $FIX. Both were found on Institutional Money Scans that I'm working on. These two are "neophytes." Turns out however, @champ, yourself and @SierraJW were on it from the earlier stages of accumulation. I didn't pay attention to the hits on my scan until 7/7/15.
And there will be the confusion between $FIX and the better know $FIT. I think there's room for both; however, $FIX has the "stealth factor."
;-)
***********referenced post***************
@GreenGhost: "(8/3/15): $TREE saw a few well timed longs jump on this one today ; AH release so far so good congrats to the longs ; stock up 7% here on elevated AH volume."
@GreenGhost:
Hey Lin! First day of the "unwinding" of July's window dressing. Here's
what's interesting, although I'd rather it be Friday, it's not. I get
better reads on Friday (being an "accumulation day").
However, 1st day of the "unwind," yields these finds:
$DAL (I'd mentioned it earlier a week or so back, from my weekly institutional scans). $LUV, $FTR (Frontier Communications?) and get this $ADSK. When was the last time someone mentioned $ADSK.
So this is part one, i.e. the SNP unwind. Take care. I'll be scanning the NDX. I'll focus on the Russell 2000, in a few weeks (weeks before Black Friday). For now however, it's the spotlight on the SNP500 and the NDX. @issues had a very compelling post on the recent additions/subtractions on the IBD50. http://tinyurl.com/ibd-50-add-minuses-issues (thanks issues).
I'll be back with the jumpers/momos of the NDX.
(jumpers = the ones that "jump out at you!")
I kept staring at your post... then it hit me.
The reason why it was clear to me is, a number of the "added stocks"
were "hits" on my weekend analysis.
Cyclically, the following:
$AKRX $ALXN $ENDP $HRTG $ICLR $NKE $PGTI $SBNY $SSNC $TMH $WETF
BTW all have good Augusts (except $HRTG). A few had good follow throughs into September and October ($ENDP).
**************referenced post*********************
@issues: "(3:15 PM 8/3/15): IBD 50 new additions this week $AKRX $ALXN $ENDP $HRTG $ICLR $NKE $PGTI $SBNY $SSNC $TMH $WETF. Discards $CRI $ELLI $NLNK $OUTR $RYAAY $SCI $SPR $TASR $TSCO $VDSI $WAL. It's curious that some good stocks are discarded and others that aren't so good are added. I wonder how they IBD determines which to add and which to discard..."
- 11:02 PM 08/03
@issues,somewhat related to you post of 3:15 PM earlier today is the following, your post underlies historical patterns.
My comment relates to historical tendencies exhibited by the larger institutions; and the resultant, derived extrapolations, i.e. which is probabilistic. Here goes:
A number of following are the "stealth builds," i.e. the "incomplete from full positions" of a few institutional buyers.
In retrospect, we already are familiar with many of the stocks that I'm mentioning. However, consider this, the below comments were made two to three weeks back, when the accumulation patterns were not as clear.
I revisited the 7/10/15 http://tinyurl.com/sheltie-report-20150710 on 7/15/15.
Re-assessed on 7/15/15 as the http://tinyurl.com/rock-solid-consolidations
Rock solid horizontal consolidation so far: : $DAL $ALK $COST $MO $CVC $KR $CMG
- 11:19 PM 08/03
8/3/15: YW @BigOx. Oh yes another "condition" to consider. On Friday, there was the EOM . So leading up to Friday, July 31, 2015, big money was doing its monthly window dressing; probably adding to their top holdings, while in their stealth manner, in order to shield "their yet to be full positions" stock interests.
This adding to their top holdings allows the big institutions to "divert attention" from stocks that they are really interested in building.
Then at the first of the month, the big institutions will unwind the "attention diverting trades" at a nice profit. Why profitable? Because they've been buying up these positions earlier in the last week of the month, then the retail bag holders start panic buying and spiking the prices. That along with the short sellers frantically closing their shorts, i.e. buying back at bad prices.
And from what I've been told many years ago, during and after the unwinding, big money resumes its buying of the "smaller" positions they wanted to add, aka: "sector or stock rotation."
So early in the following month of window dressing, comes the "unwinding."
As for the "showing as little as possible what big money is now buying," prior to attaining "full position" for that given institution, here is my cynical perspective, and this is the phenomena of the:
"Law of Don't show what you want to buy, before you are at full position."
7/31/15: Thanks Gwen!
So here's the "box score" stats, which I'll entitle: "The Battle of the Moving Averages!"
Concern: Inverted Hammer after a gap. 2) Rejected by the Red 21 EMA; OHR: 34,200,50 SMA. Earnings on 8/6/15.
Supporters: Bottoming tail hammer Thursday; Above the 3,5,8 EMA; closed above the powerful 61.8% Fib. Came off a Kicker Signal; one of the more powerful candle stick signals. Large VOLUME > 30 MA; following "capitulation selling perhaps?
Also, not on the chart: The 5.2.2 Stochastics(fast) did go below the oversold level; however, the 12.3.3 just grazed it.
************reference note************
@gwenzee: "$MDVN Reports Aug. 6 (Thurs.). Bd. of Dir. approved 2:1 split for holders as of Aug. 13th. Sales inside of U.S. up 33%, outside U.S. up 42% from Q1. Hope these events goose this stock which has been on a bit of a losing streak lately. " So here's the "box score" stats, which I'll entitle: "The Battle of the Moving Averages!"
Concern: Inverted Hammer after a gap. 2) Rejected by the Red 21 EMA; OHR: 34,200,50 SMA. Earnings on 8/6/15.
Supporters: Bottoming tail hammer Thursday; Above the 3,5,8 EMA; closed above the powerful 61.8% Fib. Came off a Kicker Signal; one of the more powerful candle stick signals. Large VOLUME > 30 MA; following "capitulation selling perhaps?
Also, not on the chart: The 5.2.2 Stochastics(fast) did go below the oversold level; however, the 12.3.3 just grazed it.
************reference note************
@gwenzee: "$MDVN Reports Aug. 6 (Thurs.). Bd. of Dir. approved 2:1 split for holders as of Aug. 13th. Sales inside of U.S. up 33%, outside U.S. up 42% from Q1. Hope these events goose this stock which has been on a bit of a losing streak lately. "
Nasdaq 100 Trivial Pursuit:
@Dan covered a nice group of unheralded overlooked stocks from "stealth like" sectors. http://tinyurl.com/weekend-update-stocks-20150801
Which inspired me to ask this question: Name me five stocks from the Nasdaq 100, that are unheralded and undergoing a similar "stealth like recovery?"
Well the names are already on the above header, so the question is rhetorical vs. challenging. BTW, these stocks could be gotten at a discount in the coming week; given the expected two way, up down market action.
******** (well at least that's what my benchmarks are pointing to).
$FAST $GMCR (yes... the one that had gapped down) $KLAC $LVNTA $SPLS
Full Disclosure: I will revisit this post in the first week of September, as a means of assessing a scan that I've been working on, i.e. "the Big Money" institutional tracker.
7/26/15: goose: You are a probably a better chart reader than I am,
I completely missed the "potential H&S,": attending to the minutia. Even though you disagreed, it was nice that you pointed out the possibility!
I would agree, however, that there was a H&S. The head IMO would be the 102.84.
Here's the H&S math (approx numbers)
Head - neck line = difference
104.84 - 98.94 = 3.90
Neck - Difference = Target.
98.94 - 3.90 = 95.04
So the math works out for the HS pattern. The question is, which direction, now that the pattern has "met its price target?"
A few other questions:
At Currently $94.75, it's breached the target, so:
1) Possible bounce, retracement up?
2) Or follow through selling? BTW, I failed to mention that July 22 is a "#IHTRC" (I Hate Tall Red Candles")
********reference post*********
@goose: "it does not look like a Head & Shoulders"July 16, 2015: Confused on what to do? Why not look at the uptrending Weekly and Monthly charts? You can use this template for the weekly perspective: http://schrts.co/OOVxLR, just plug in the symbol, included are my chart parameters. If anyone can help the newbies on a website that displays the monthly charts, that would be appreciated.
Here are a few boring stocks from my scan to get you started: $HRTG $TSO $MBLY (my longer time FAV) $DEPO $ALXN $KHC $EA $CTRX $CB
$FL (distributor of $UA & $NKE, look at its Wkly & Mo LT uptrends)
$HCA and $LEN.
July 13, 2015: One of the most important links: You had all the resources. And it was a gradual scale in that would've worked. Amritsari and Fitz both got in a day early on 7/7/15 with the dragonfly doji.
http://i.imgur.com/po0rdwa.jpg

July 12, 2015:11:53 AM: Regarding the question will the market be up or down tomorrow, I would think we start up, then hold that small gap throughout the day, and possibly close on the weaker side. And I would not be surprised if we gap down lower. There's going to be opportunities tomorrow for action on both sides. Remember what Cindy Faber said about the 8:30 AM time. Remember the Bond Market closes an hour before the stock market and professionals begin closing their positions about that time. The trend will lesses about that time, whether up or down, then after the professionals close their positions, the trend will resume. This is such valuable information.
18:16pm 7/10/15: I've presented the positive with regard to the tweak up with the BPNYA.
http://i.imgur.com/439vWMp.jpg
However, we are currently extended momentum wise.
And second, the IWM will be meeting up to the 61.8% Fib at the 124.25 level. Looks easy enough since the IWM closed today, Friday, July 10, 2015 at 124.13, with a late day surge.
Except... the late day surge was panic buying and with help from short covering.
It looks to me, we have a high probability to open higher inside Friday's range. I'd be very impressed if we are able to "gap up"
6:38 AM 7/10/15: $TASR broke above the 8 EMA today, reversal candle yesterday. Today is a confirmation of the "spinning top" candle yesterday. Confluence of signals. When I closed the position in June. My intent was to re-enter.
Per @DAN's suggestion I kept a "place holder" position of one share. When it got near enough to my previous buy point, I decided to re-enter.
Please look at how it consolidated during the tough several days. My hard stop is 30.97; my "soft stop" as always is if $TASR breaks below the 8 EMA.
Good luck all. :-)
(from my journal entry)
*************reference post*************
@janner0814: "Re-entering $TASR; earnings near the #EOM."
05:50 AM 07/09
@champ. Taking the early morning watch from you. Thanks for your earlier notes.After a few attempts of going long intraday and getting turned back, I can honestly say, yesterday felt like the "atypical day" where the momentum did anything it could to discourage long entries. The short term traders and algorithms, "earmarked the /ES Futures 2040 level" as key, as indicated from the price action of the past two days. The past two days, the /ESF 2040 level was approached and breached at least four times, culminating with a slight close below it. "Short Traders with Bigger Than Small Money" are playing on the fears of seasoned and inexperienced traders. Best instead to go biking, swimming, skate boarding or paddling.
BTW, the /ES volume at 11:00 AM (#ESFV@11) was the second day of a back to back days >1 million shares (#1mst) traded (7/7 & 7/8). The last time the #ESFV@11 was > #1mst was June 16, 2015. And PRIOR to that, January 14 to January 16, 2015, i.e. three consecutive days where the #ESFV@11 was > #1mst .
Hmmmm.... Now that I reflect back on this phenomena, I find it odd that the /ES Volume for the Spring was somewhat low, while the "summer doldrums volume to me thus far, " is oddly higher than what I recall. World events and catalysts noted, news media and their associates now have their own "news related catalysts" to earn their buck. But having the >#1mst for #ESFV@11 during the summer on back to back days? It's definitely ATYPICAL.
So, the overnight looks to support the snap back. All Futures indices up at least 0.55% with the Russell lagging the other four. /NKD up 2.7% while the DAX up 1.00%.
Later today, those who took the gutsy $SVXY $XIV and short $VXX; hopefully are rewarded.
So I'll ride the trend up for however long it'll be.
Have a good day everyone, I'll be going back to my watch and number crunching.
Remember: Today is #ORT and there are also a few other wrinkles to make today a "two way trading day."
http://i.imgur.com/5yLbQph.jpg
*********reference note*********
@champ: 01:38am 07/09: "Just a note before I turn in here in California. In China the markets are now turning and the Shanghai is up nearly 6% in the overnight trading thus far. In the US the Mini Futures are now up 98 and oil is at $52.51 up $0.86. "
7/5/15: need to close at least two positions: BLUE and KRE.
http://i.imgur.com/OmZA1v8.jpg
7/4/15 06:13 AM Saturday: I know DF has reiterated extreme caution, in the market. However, I am looking at GBX and with all due respect to DF's call, this is a bullish sign. http://i.imgur.com/1jDhb4T.jpg
I am in the bullish minority and I do tend to be early. And, let's reiterate some very important rules:
RULE #1: Don't lose your money.
RULE #2: Don't forget rule #1.
That being said. Look at the $GBX chart. This is awfully bullish to me. Confirmed Bullish engulfing pattern with a little kicker (spinning top). I'm using links since the imbedded jpgs are not very clear.
7/3/15 03:55 AM Friday: While much of the world is focused on the "Grexit" news as the MAIN reason why we'd that ***LARGE DISTRIBUTION on Monday, June 30, 2015. I look at it as the market unwinding the Window Dressing. The unfortunate Sunday Greece news was a major catalyst.
However, the gasoline on the firewood was already there. Please read my posts. My observations are time stamped. And I did very little during my posts to even mention the "Greece situation." Instead, I referred to the End of the Quarter, lack of earnings and other related catalysts. http://i.imgur.com/Z3rOLv3.jpg
(not to be confused with the "more benevolent liquidation break,")
So I've alluded to the expected "unwinding of the Quarterly Window Dressing" from 6/26/15.
http://tinyurl.com/unwinding-comment-20150626 The goal of my comments is not to beat my chest, as much as cite the value of one's journal. I've learned to observe phenomena, which is a large part of my training in physical rehabilitation. However, the aforementioned link is an "anticipating opinion," based on years of observation. And it has little to do with Greece.
As many of you may notice, I am a journal freak. I do NOT like to have entries in my journal that are misconstrued of market reality. So contrary to what Dan might do, I do go back to my prior comments and evaluate these comments. Needless to say, I am VERY critical of my comments of that are misleading. In doing so, I've become "less misleading."
BTW< this is in no way a criticism of Dan, since I've learned so much from Dan. However, my comment is reflective of a "style and mindset that I prefer to adhere to." And as Dan has taught me, "do what works for you."
Please note the warning signs were escalating throughout the week.
For one the inverse $SOXS was spiking, which did NOT bode well for the
http://tinyurl.com/20150626-janner0814
7/3/15 03:35 AM Friday: Kevin: In my least cynical, cynical tone of mine's, it's exactly what we need in order for the market to reach higher levels.
It's only now the "taxi drivers and doughnut shop baristas" are no longer talking about $AMBA and other stocks to buy.
Consider the Weekly Survey of the AAII (yes I do read a few other benchmarks, but not the news).
Method:
1) First a placeholder is needed. Say of about one to five shares. Always start with stock, because it is shown on your Current Positions. ALWAYS.
2)
https://www.russell.com/indexes/americas/indexes/fact-sheet.page?ic=US2000
russell reconstitution:
http://www.russell.com/indexes/americas/tools-resources/reconstitution/additions-deletions.page?#indexes
Remember below that VRX is the stock per Ross Givens.

June 24, 2015:
The power of the Three Day Rule, i.e. one of the most crucial adjustments to my trading.
Remember as our mentor reminds us, i.e. "It's a rule of thumb." So the exact manner that we apply is determined in large part by the instruments we trade. Which is why I've focused on:
1) Volatility based trades;
2) The Russell via $TNA. The Russell gives me tons of signals. Just this year alone, I've executed thousands of trades in $TNA. No exaggeration. And much like batting practice, the more you engage in an activity, the more aware you become of the nuances that lead one to improved results.
However, what's been helpful in my trading the past year has been the process that has lead to:
1) "My edge." How does one determines one's edge? Self awareness is the best process. And my method of improving my self awareness is by journaling.
2) Journaling. I trust my journal,my personal notes to myself and scans, I cannot say the same for news media. The only websites I read are those here at SMM. Otherwise, my edge is to be "News media illiterate." Once again, I refer to a fine video by Jim Cramer. I've repeatedly posted this link for the newbies. I've entitled this link in my virtual journal as: Jim Cramer's:
"Using CNBC and Bob Pisani as a ploys." http://tinyurl.com/market-ploys
OK the Market will begin it's path towards Distribution Mode. Please all of you pull your journal out. Entitle this "Quarterly Window Dressing." The more you depend on your own observations, the better the journal gets.
Here is a personal, journal entry that applies to a "budding scenario:"
I call this process the retail traders, bag holder's dilemma (RTBHD). And the RTBHD starts or ends in the same manner, i.e. either selling or entering a trade at poor "trade location."
For example with $AMBA, at $124, it was an overpriced stock. DAN warned us repeatedly as $AMBA trekked towards nosebleed territory. Then last Friday, June 19, 2015, we witnessed the "I Hate Tall Red Candle Day," (#IHTRC), the bag holder who paid $124, probably indecisively and impulsively(II) sold $AMBA at its bottom on Tuesday, 6/23/15 at $93.06.
Similar yet in reverse, is a "potential RTBHD for $AMZN," it was oversold a couple of weeks ago at $390; perhaps even at $445 its current price. However at $475 to $525, $AMZN is not as oversold. So will there be an $AMZN panic buying? We shall see. The market could spike $AMZN's prices to create the reverse RTBHD scenario for $AMZN, i.e. "panic buying," ignited most probably by short covering.
*** RTBHD: My monicker for "retail traders, bag holder's dilemma"
***********the market today 6/24/15 Wednesday:
The DAX is divergent to the U.S.Futures,Nikkei and the HangSeng. Big money knows that most are focusing on the middle eastern drama. Needless to say, more power to me. BTW, I could envision big money literally putting cash into to the DAX just to "fakeout retail traders." Is this happening? I truly don't know.
However, my entire portfolio went from >800 delta to a -363. And my $TNA Delta went from sky high to -928.
IMO, the market spike up yesterday may have been the Bull Trap, set off by Index short covering. In parts of yesterday, I accumulated small bits of $UVXY, I loved how the market kept spiking down the price. What a friggin' game..... because:
"I've seen this movie so many times before." Volatility will be increasing today. Puts will be a little more expensive today than yesterday. BTW, besides selling a bunch of short calls on $TNA, I did also bot a few bear debit put spreads on $TNA. (Journal Entry: Puts and debit spreads are cheapest right at the "inflection.")
http://tinyurl.com/be-ready-to-rumble
Market Calendar for this week.
http://i.imgur.com/kAG8guo.jpg
June 21, 2015 Sunday: agent99: Hope you are doing well. I've enclosed a graphic.
So go to the "Trade" Page (top border per graphic)"
Please refer to the graphic.
Many of the TOS functions are hidden under the "sprockets" or "gears"
I'm not as familiar with the conditional stops since I rarely use it. I've found support@thinkorswim.com very helpful. I'm sure they'll answer the majority of your questions and concerns.
****reference note******
@agent99: "I am starting to use TOS. Can someone tell me how to enter conditional stops? I checked the help videos and I did not see conditional stops where the market order does not go out until the price target is hit."
June 20, 2015 Saturday:
6/20/15 10:23 AM Saturday: Just doing some reading and of course one of the reasons why the $SPY dropped as it did, was it went x-div on Friday, June 19,2015; with a $1.03007 dividend. Then next week, respectively on June 22nd and 24th, the other two SNP500 etfs $VOO and $IVV also go x-div.
I'm just wondering how aware are most traders of these etf x-divs? This is an event that I've followed for several years, since trading $TNA, i.e. the proxy for the $IWM. BTW the x-div date for the Russell comes on July 2, 2015, about two weeks from now. And the pay out is on July 9, 2015.
BTW: The Pay dates for the SNP500 related instruments are as follows:
$SPY (7/31/15 for the 6/19/15 x-div)... yeah over a month after its x-div date
$IVV (6/30/15 for the 6/24/2015 x-div)
$VOO (6/22/15 for the 6/26/15 x-div)

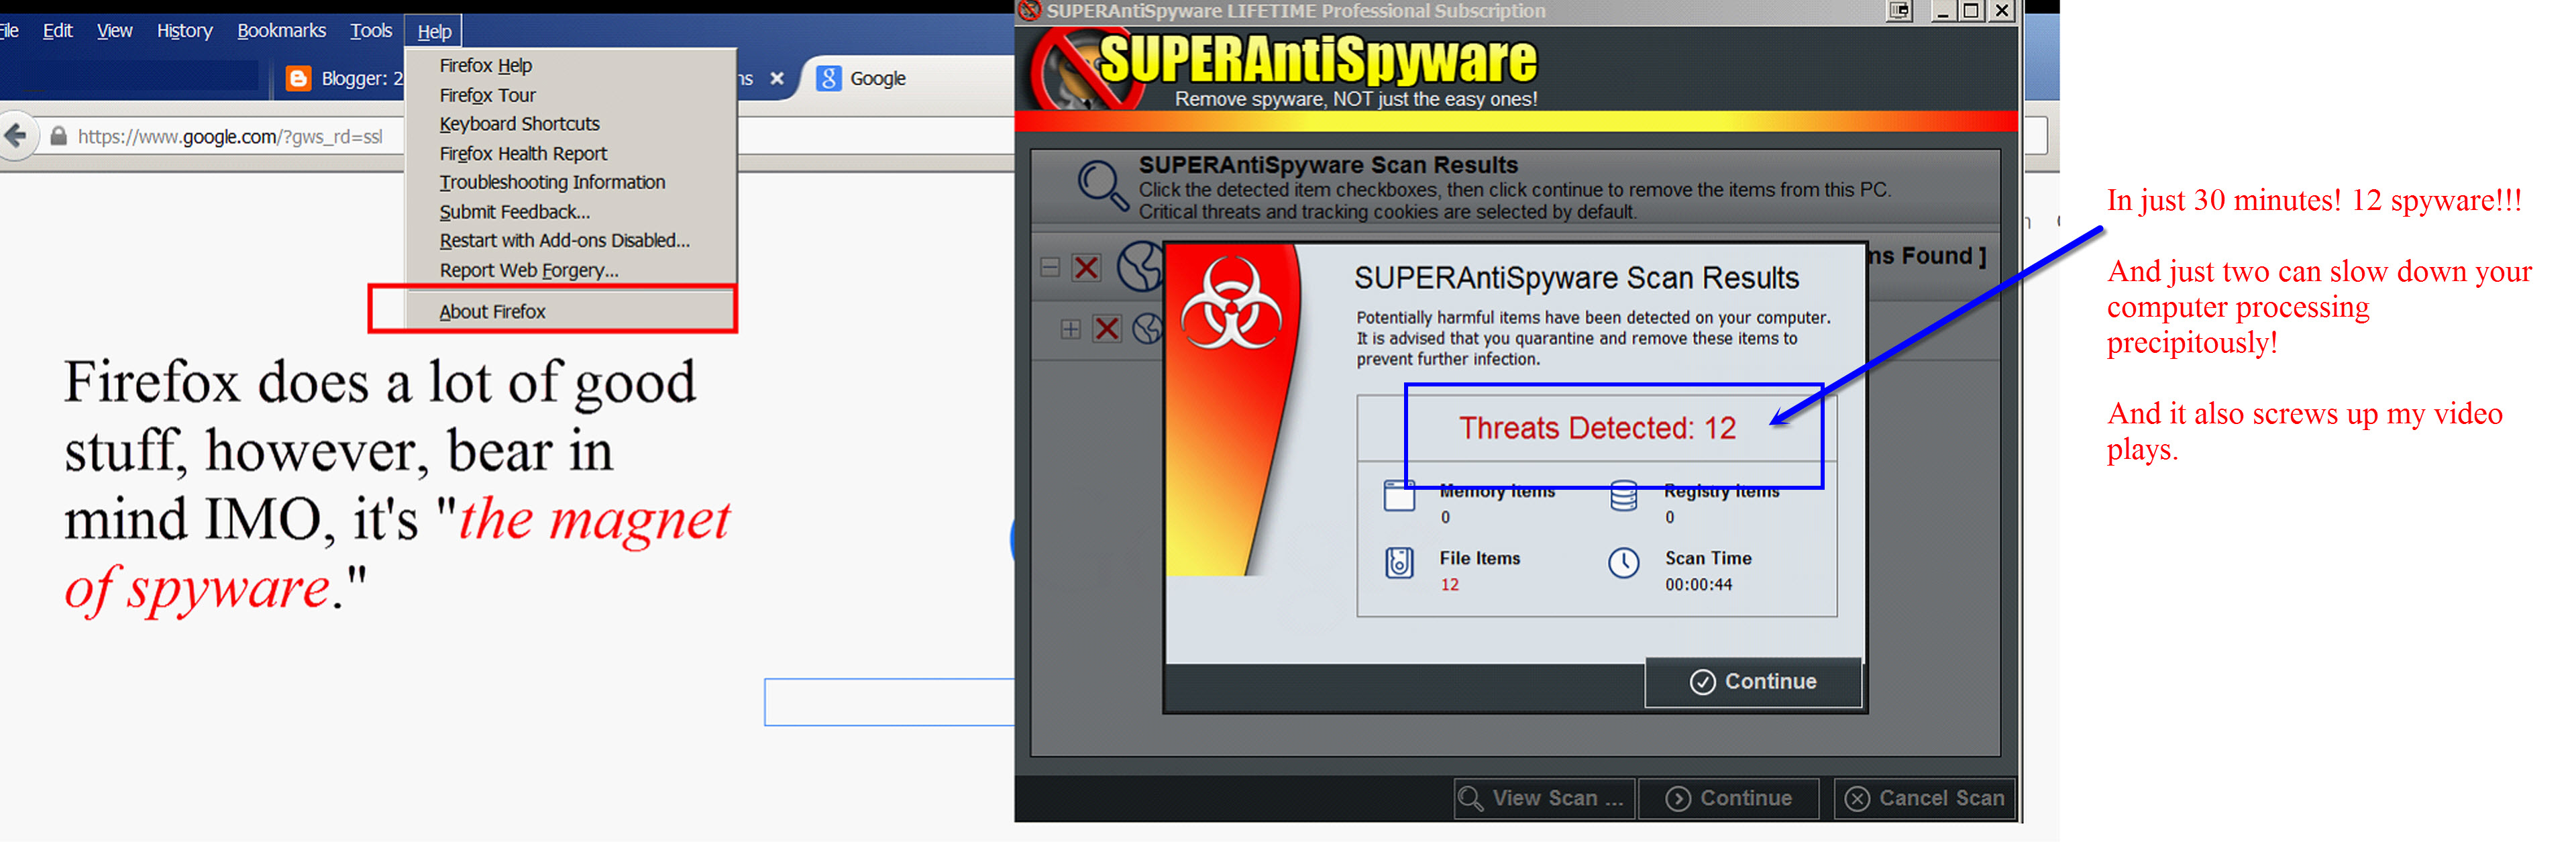
Firefox is the beckoner of spyware. Consider doing this if you are using either Firefox or Chrome. Run Superantispyware (it's free). http://www.superantispyware.com/
I'll run SAS 3-4 times a day, even when my browser is shut down. The spyware's negative efficacy is enough that it slows my #thinkorswim #IB and #livevol trading platforms.
I personally use the "Quick Scan" function, choosing NOT to tie up my valuable RAM with prolonged activites during the busiest of times. Hope it helps.
*************reference notes*******************
@GOOSE (09:52 AM 06/20): "#Weekend Strategy Session. Sorry, it didn't work. I appreciate your time in trying to help me solve this conundrum. GOOSE Enjoy the rest of the weekend."
@Tr8dr:(09:40 AM 06/20):"Sometimes restarting your computer works"
@GOOSE (09:37 AM 6/20/15): "#Weekend Strategy Session: I have been trying to access the Weekend SS, but to no avail. The notes, I can bring up, but the SS's, not. Can somebody please walk me t
June 19, 2015 Friday: Meet with Sus!
The Signs for Monday, June 22, 2015.
I rushed out... Here's the chart that told the story near the close. Confident of a liquidation pull back on $TNA, possibly even a small gap down at the open of next week.
*******************Readying for Next Week************
Interesting Stat for the Next Two Weeks: No Earning Releases; just dividend releases.
....Monday: Existing home sales at 10:00am;
....Tuesday: Durable goods (8:30 AM Premarket) and New Home Sales (10:00 AM).
....Wednesday's GDP (8:30 AM Premarket).
.....Thursday's Jobless Claims and Personal Income, (both premarket 8:30 AM).
*******************End of Readying for Next Week************
@janner0814: (4:04 PM 6/19/15: "Closed all $TNA commons near the close. Was getting tight on time. However, $TNA pull off a run to the close. Then it held up long enough so I was able to sell calls and pretty close to the highs.....")


However, the gasoline on the firewood was already there. Please read my posts. My observations are time stamped. And I did very little during my posts to even mention the "Greece situation." Instead, I referred to the End of the Quarter, lack of earnings and other related catalysts. http://i.imgur.com/Z3rOLv3.jpg
(not to be confused with the "more benevolent liquidation break,")
So I've alluded to the expected "unwinding of the Quarterly Window Dressing" from 6/26/15.
http://tinyurl.com/unwinding-comment-20150626 The goal of my comments is not to beat my chest, as much as cite the value of one's journal. I've learned to observe phenomena, which is a large part of my training in physical rehabilitation. However, the aforementioned link is an "anticipating opinion," based on years of observation. And it has little to do with Greece.
As many of you may notice, I am a journal freak. I do NOT like to have entries in my journal that are misconstrued of market reality. So contrary to what Dan might do, I do go back to my prior comments and evaluate these comments. Needless to say, I am VERY critical of my comments of that are misleading. In doing so, I've become "less misleading."
BTW< this is in no way a criticism of Dan, since I've learned so much from Dan. However, my comment is reflective of a "style and mindset that I prefer to adhere to." And as Dan has taught me, "do what works for you."
Please note the warning signs were escalating throughout the week.
For one the inverse $SOXS was spiking, which did NOT bode well for the
http://tinyurl.com/20150626-janner0814
7/3/15 03:35 AM Friday: Kevin: In my least cynical, cynical tone of mine's, it's exactly what we need in order for the market to reach higher levels.
It's only now the "taxi drivers and doughnut shop baristas" are no longer talking about $AMBA and other stocks to buy.
Consider the Weekly Survey of the AAII (yes I do read a few other benchmarks, but not the news).
Method:
1) First a placeholder is needed. Say of about one to five shares. Always start with stock, because it is shown on your Current Positions. ALWAYS.
2)
https://www.russell.com/indexes/americas/indexes/fact-sheet.page?ic=US2000
russell reconstitution:
http://www.russell.com/indexes/americas/tools-resources/reconstitution/additions-deletions.page?#indexes
Remember below that VRX is the stock per Ross Givens.

June 24, 2015:
The power of the Three Day Rule, i.e. one of the most crucial adjustments to my trading.
Remember as our mentor reminds us, i.e. "It's a rule of thumb." So the exact manner that we apply is determined in large part by the instruments we trade. Which is why I've focused on:
1) Volatility based trades;
2) The Russell via $TNA. The Russell gives me tons of signals. Just this year alone, I've executed thousands of trades in $TNA. No exaggeration. And much like batting practice, the more you engage in an activity, the more aware you become of the nuances that lead one to improved results.
However, what's been helpful in my trading the past year has been the process that has lead to:
1) "My edge." How does one determines one's edge? Self awareness is the best process. And my method of improving my self awareness is by journaling.
2) Journaling. I trust my journal,my personal notes to myself and scans, I cannot say the same for news media. The only websites I read are those here at SMM. Otherwise, my edge is to be "News media illiterate." Once again, I refer to a fine video by Jim Cramer. I've repeatedly posted this link for the newbies. I've entitled this link in my virtual journal as: Jim Cramer's:
"Using CNBC and Bob Pisani as a ploys." http://tinyurl.com/market-ploys
OK the Market will begin it's path towards Distribution Mode. Please all of you pull your journal out. Entitle this "Quarterly Window Dressing." The more you depend on your own observations, the better the journal gets.
Here is a personal, journal entry that applies to a "budding scenario:"
I call this process the retail traders, bag holder's dilemma (RTBHD). And the RTBHD starts or ends in the same manner, i.e. either selling or entering a trade at poor "trade location."
For example with $AMBA, at $124, it was an overpriced stock. DAN warned us repeatedly as $AMBA trekked towards nosebleed territory. Then last Friday, June 19, 2015, we witnessed the "I Hate Tall Red Candle Day," (#IHTRC), the bag holder who paid $124, probably indecisively and impulsively(II) sold $AMBA at its bottom on Tuesday, 6/23/15 at $93.06.
Similar yet in reverse, is a "potential RTBHD for $AMZN," it was oversold a couple of weeks ago at $390; perhaps even at $445 its current price. However at $475 to $525, $AMZN is not as oversold. So will there be an $AMZN panic buying? We shall see. The market could spike $AMZN's prices to create the reverse RTBHD scenario for $AMZN, i.e. "panic buying," ignited most probably by short covering.
*** RTBHD: My monicker for "retail traders, bag holder's dilemma"
***********the market today 6/24/15 Wednesday:
The DAX is divergent to the U.S.Futures,Nikkei and the HangSeng. Big money knows that most are focusing on the middle eastern drama. Needless to say, more power to me. BTW, I could envision big money literally putting cash into to the DAX just to "fakeout retail traders." Is this happening? I truly don't know.
However, my entire portfolio went from >800 delta to a -363. And my $TNA Delta went from sky high to -928.
IMO, the market spike up yesterday may have been the Bull Trap, set off by Index short covering. In parts of yesterday, I accumulated small bits of $UVXY, I loved how the market kept spiking down the price. What a friggin' game..... because:
"I've seen this movie so many times before." Volatility will be increasing today. Puts will be a little more expensive today than yesterday. BTW, besides selling a bunch of short calls on $TNA, I did also bot a few bear debit put spreads on $TNA. (Journal Entry: Puts and debit spreads are cheapest right at the "inflection.")
http://tinyurl.com/be-ready-to-rumble
Market Calendar for this week.
http://i.imgur.com/kAG8guo.jpg
June 21, 2015 Sunday: agent99: Hope you are doing well. I've enclosed a graphic.
So go to the "Trade" Page (top border per graphic)"
Please refer to the graphic.
Many of the TOS functions are hidden under the "sprockets" or "gears"
I'm not as familiar with the conditional stops since I rarely use it. I've found support@thinkorswim.com very helpful. I'm sure they'll answer the majority of your questions and concerns.
****reference note******
@agent99: "I am starting to use TOS. Can someone tell me how to enter conditional stops? I checked the help videos and I did not see conditional stops where the market order does not go out until the price target is hit."
June 20, 2015 Saturday:
6/20/15 10:23 AM Saturday: Just doing some reading and of course one of the reasons why the $SPY dropped as it did, was it went x-div on Friday, June 19,2015; with a $1.03007 dividend. Then next week, respectively on June 22nd and 24th, the other two SNP500 etfs $VOO and $IVV also go x-div.
I'm just wondering how aware are most traders of these etf x-divs? This is an event that I've followed for several years, since trading $TNA, i.e. the proxy for the $IWM. BTW the x-div date for the Russell comes on July 2, 2015, about two weeks from now. And the pay out is on July 9, 2015.
BTW: The Pay dates for the SNP500 related instruments are as follows:
$SPY (7/31/15 for the 6/19/15 x-div)... yeah over a month after its x-div date
$IVV (6/30/15 for the 6/24/2015 x-div)
$VOO (6/22/15 for the 6/26/15 x-div)
10:21 AM 06/20
@Goose: If you are using either #Mozilla Firefox or #Chrome then it may explain your issue. I use Firefox, IE 8(64 Bit) and Seamonkey(the BEST).Firefox is the beckoner of spyware. Consider doing this if you are using either Firefox or Chrome. Run Superantispyware (it's free). http://www.superantispyware.com/
I'll run SAS 3-4 times a day, even when my browser is shut down. The spyware's negative efficacy is enough that it slows my #thinkorswim #IB and #livevol trading platforms.
I personally use the "Quick Scan" function, choosing NOT to tie up my valuable RAM with prolonged activites during the busiest of times. Hope it helps.
*************reference notes*******************
@GOOSE (09:52 AM 06/20): "#Weekend Strategy Session. Sorry, it didn't work. I appreciate your time in trying to help me solve this conundrum. GOOSE Enjoy the rest of the weekend."
@Tr8dr:(09:40 AM 06/20):"Sometimes restarting your computer works"
@GOOSE (09:37 AM 6/20/15): "#Weekend Strategy Session: I have been trying to access the Weekend SS, but to no avail. The notes, I can bring up, but the SS's, not. Can somebody please walk me t
June 19, 2015 Friday: Meet with Sus!
The Signs for Monday, June 22, 2015.
I rushed out... Here's the chart that told the story near the close. Confident of a liquidation pull back on $TNA, possibly even a small gap down at the open of next week.
*******************Readying for Next Week************
Interesting Stat for the Next Two Weeks: No Earning Releases; just dividend releases.
....Monday: Existing home sales at 10:00am;
....Tuesday: Durable goods (8:30 AM Premarket) and New Home Sales (10:00 AM).
....Wednesday's GDP (8:30 AM Premarket).
.....Thursday's Jobless Claims and Personal Income, (both premarket 8:30 AM).
*******************End of Readying for Next Week************
@janner0814: (4:04 PM 6/19/15: "Closed all $TNA commons near the close. Was getting tight on time. However, $TNA pull off a run to the close. Then it held up long enough so I was able to sell calls and pretty close to the highs.....")
mradams, we've all been there where you are and
I'm confident in a year you'll move away from following the advice of
others. Never have used Cramer's service; just use Dan's.
Who can you trust?
In a seemingly trite comment, your method. There are many comments here, some extremely prescient and in comparison, one worthy of my contrarian call rating. However, that is besides the point.
The point is, instead of trying to find: "Which stock is hot?", learn instead to develop your method. And likewise, to discover your process leading to developing your method.
You have your journal, IMO that is the best starting point. So my suggestion is get started in developing your OWN method.
One of my few methods is to discover the successful aspects of other's methods. And by doing so, I've discovered the nuances that have led to better trading for myself. My goal now is to understand the methods of others, and the end result being, developing my own protocol for the given situation.
So if the trade fails what do I do? I leave the trade and move on.
.......( BTW: "Failures" of my method are MUCH less; since I'm familiar with my own parameters of entering the trade)
However, if I were to follow someone else, what could happen? I would have to track that person down, wait for his advice to remedy the matter. That could take DAYS. And in this market scenario, DECISIVENESS based on one's method is rewarded. Indecision is punished. JMObservation.
Needless to say, following other's advice has worked inconsistently for me. However, this is what works best for me, given stock picks from others, i.e. when that particular stock "intersects" to a "pick from my personal method," i.e. the stocks suggested were popping up on my scans and in my journal. Or if there's no intersection of specific instrument, I go to its industrial sub-sector; there is always some match to my watchlist.
Oh yes, develop your watchlist; familiarity with stocks will add to your trade conviction.
Many ways to peel a potato (I no longer use my old, politically incorrect animal quotes, since my youngest daughter is an animal rights activist).
So, in lieu of following anyone, consider instead to develop your own method.
Then one's next step is to "learn trade conviction." There are many here on the site, that have that conviction for different reasons. That in itself, is another process to develop.
******************reference note**********************
@mradams0621: "08:49 PM 06/18/15: ..... I also use IBD 50 list as a guide, Cramer's Action Alerts Plus, which I love cause it has weekly updates with a well thought out thesis and opinions on WHY each is rated higher or lower- but he's wrong a lot also. No great track record for being "right", just opinionated. Who CAN you trust?"
@TunaHelper $CDE
Yes I agree with most of that. Apparently I failed again at my effort
to create a humorous post. But I did think he meant it as a swing trade
more than a day trade, so I'm still in for the ride till she bucks me
off. Maybe even keep a piece for a "bottom picken" trade. Can't go
down forever can it? Metals are so overdue for a bottom. As for Schwab
and Fido ratings in regard to fundy's- I wish I knew if they were worth
trusting as input or not. After all these years I still have no clue
how much to let them influence my trading. All I know is, I stink at
fundy's. It's really really hard to get right. So, if I know I stink at
it, at least maybe I can get better results from trusting
professionals. Or maybe an average of a bunch of professionals. They
may not get it right either, but surely their track record should be
better than my own, right? At least they should be better at it if they
claim to be professionals. But I do not know how to measure it, so I'm
left clueless. But as long as we are having fun, and not loosing more
than we make, we can keep trying to get better, right? Other than being
good at it, where is the best source for fundy's? I also use IBD 50
list as a guide, Cramer's Action Alerts Plus, which I love cause it has
weekly updates with a well thought out thesis and opinions on WHY each
is rated higher or lower- but he's wrong a lot also. No great track
record for being "right", just opinionated. Who CAN you trust?
- 08:49 PM 06/18
6/17/15 06:38 AM Wednesday: Nimble move rolling long calls from deep OTM north. The short calls are yet to be profitable so I'm leaving it alone. Did buy TNA stock and also being very patient with my short TNA calls which expire this Friday.
Monday, June 15, 2015: 21:19 PM. Tricia you posting here now and not at SMM? All good, I won't write you anymore because you are in your own world of trading. Thanks. @ron
From Chatzy June 15, 2015
Tricia: AERI - + FDA // 10:01
Tricia: AAVL + 2aPII data for wet AMD - macualar degenereation 10:03
Tricia: AAVL beasting AH! 10:05
hotwire: AEHR press release new order from mobile chipset manufacturer in China 10:06
browley: AAVL fell 50% in minutes 10:18
ScoopDogg: SOL ww tomorrow good vol. today 10:18
boogie: AAVL wow - was trading at 51 up 10 when I last looked - now down to 25 11:04
hotwire: feel sorry for the people who chased AAVL in the $50s 11:48
Tricia: AAVL - no position - but insider sellling, and misrepresentation re efficacy and data ... 11:53
hotwire: AXPW 0.235 crazy
Monday, June 15, 2015: Seriously @comito: Aren't most of your trades by way of scaling in. If you were to pile into a position, wouldn't that trigger the trading algorithms? I would think so. BTW: Many of your picks seem to com from SMM; have you ever heard of such a service?
Monday,
June 15, 2015 21:20 PM: So what is so wrong about $JD. It's currently
trading at $36.63; on Friday, June 12, 2015, it hit the OHR, i.e. the +1
Standard deviation resistance and retreated to its current price of
$36.63. Monday was a sell off day. $JD is still above the 8 EMA, i.e.
"t-line."
VDSI
- 6/3, 6/8, and today 6/15 but much smaller size with each successive
buy on the way up. I guess textbook is 50% on first then 30% on second
and 20% of you total position size on third. I did more like 75% and
then 25% and then overweighted it today by about 10%.
Monday 15, 2015 21:12 PM: @AG I like the way you described @comito's method of entering a stock, i.e. "pyramiding." @ron
Monday 15, 2015 21:12 PM: @AG I like the way you described @comito's method of entering a stock, i.e. "pyramiding." @ron
@comito
Can you give me an example when time permits, when you made multiple
buys and sells on a stock? This something Im trying to understand
desperately. Some say pyramiding is a better way to do it, It sounds
great to me, the basic fundamental idea, but I haven't been able to
really grasp the when and how part of it.
Monday, June 15, 2015 21:24 PM: This @comito is really an interesting and thought provoking poster. I liked his posts on $ESPR, which is @Aragorn's fav trade of late and is currently an unconfirmed bullish piercing pattern perhaps?
Monday, June 15, 2015 21:24 PM: This @comito is really an interesting and thought provoking poster. I liked his posts on $ESPR, which is @Aragorn's fav trade of late and is currently an unconfirmed bullish piercing pattern perhaps?
ESPR
was a different story though in March. much better shallower base. RS
well into new highs before the stock price hit new highs. wish I had a
bigger position in it.
ESPR
is a bio example that I took on 5/19 that definitely did not work using
the RS as a guide. . luckily I had sold 1/2 on 5/21. A stock after
breaking should not have a red bar day, especially finishing near the
bottom of the range- with volume averaging higher than the breakout day.
Nothing is 100%.
@ag I would focus on stocks with an RS in the 90's. basically the higher the better. Many of my big winners have been 99.
Monday 9:03am 6/15/15: AERI with a notable after hours move


01:46 AM 06/16
Overnight session with a minor reversion to crude, up to 60.16, 64c (1.08%)*************reference notes*************
@janner0814: 01:41 PM 06/15: "Entered reconnaissance position on $VLO $58.16.:
@janner0814: 01:22 PM 06/15: "Long partial position $ERX $52.21; I might add."
Huge day of profits. Closing my $TNA short calls (main source of profits). Rolled up a few call on the Jun4. Buying $TNA commons; Buying $SVXY commons; also bot a few calls $SVXY. Fun day.
I just might be done for the rest of the day until 2:00pm. :-)
These "windows of opportunities, come and go very quickly." And it's best to have a feel of the market. Forget that other country, focus on the what's going on.
We're the short brothers; gueriila warfare. Taking what the market gives us! ;-) Hey, you're not doing too badly yourself. Congrats bill!
BTW: Bill if you didn't get a chance to check this out, please do so. It's the first website that I see, whenever I open ANY and all browsers.
http://i.imgur.com/A2DXJHu.jpg
Good luck!
@billfumick: Nice!! $TNA
Hey guys: OTF (other time players) time! 1.07million /ES contracts at 11:00 AM. Not sure of the direction. These guys just come in at certain levels. And it looks to me it's buying per 1K TICKS just after 11:00am. And I meant buy and sell TICKS not the biting types.
BTW:
"Or if in a tent in Alaska during certain times of the year, never go bare with noseeum and mosquitos in the tent."
@tkcoretrader: "@DAN Moral of the story: don't get in the same tent with a bear."
Overnight session with a minor reversion to crude, up to 60.16, 64c (1.08%)
*************reference notes*************
@janner0814: 01:41 PM 06/15: "Entered reconnaissance position on $VLO $58.16.:
@janner0814: 01:22 PM 06/15: "Long partial position $ERX $52.21; I might add."
"Be mindful when others are saying... get the hell outta here!"
Double ouch! I left private practice because it wasn't as much fun due to all the O/C stuff.
@billfumick: I'm in with you on $AMZN (only 10 shares as my proxy to "staying engaged" with the trade... $424.75). Next step will be figuring out a few debit call spreads. I'll post 'em when the time's right.
@NotRightRabbit: "@janner0814 For better or worse don't forget the SECOND #Obamacare"
Long partial position $ERX $52.21; I might add.
"Be mindful when others are saying... get the hell outta here!"
For anyone interested seeing a graphical view of my $TNA and $SVXY trades; please look at the enclosed graphic. The "key to my method" is being mindful of what's going on with the market.
http://i.imgur.com/A2DXJHu.jpg
Needless to say, I do spend some time prepping for the upcoming week. 90% of my getting ready for today's action was already done four days back.
@janner0814: "(01:41 PM 06/12) Here's what concerns me about $TNA (my proxy for trading the Russell 2000, $IWM). BTW the Russell being a small caps index is often the early tell when going up or down, since the nature of its "stock population" is one of speculation.
Bill I like that $AMZN long.
@billfumick: "Longs, $AMZN, $FEYE, $TASR, $TSLA"
Oh no! I hope not... wait a minute... let's see. If $ANTM buys $CI, then $UNH bids for $ANTM.... hmmmm... (being the turncoat I am)... I'd like that! (lol!)
@Chucky: "They way these mergers are going we might just end up with one health insurance provider."
Well said Chucky!
And what a different one year makes, for me at least. I'm much more in sync with Dan's thinking than I was last year. LY I would've been indecisive about entering the trades. This year, I've been in lock step with Dan's videos and his thoughts. Less inertia for me than last.
@Chucky: " Hi Bridget. If it is any consolation, with you and Dan's analysis and effort most of us SMM are in and prospering. These $Hack equities can make a P&L year right now. Thank you for all you do."
@am: From the way companies have been cutting back on the Triple ETFs, I doubt there's going to be a "Triple ETF for Cyber security."
IMO it's too specific. IIRC companies have shut down a couple of triple etfs of the indices.
I'd just trade the ETF if anything. I definitely would NOT do its options, the spreads are wide enough to drive a truck through it (Dan's description of poor liquidity).
Hmmm.... you've given me an idea on my $FEYE & $CYBR (yes I did get filled) positions.... I could start selling calls against 'em ......$FEYE looks more liquid than $CYBR, with regards to bid/ask. (BTW: Both $FEYE and $CYBR have weekly options). Nah! I'll just deal with the common stock.... I'm spoiled with the b/a of TNA... $FEYE and $CYBR don't have enough choices in their options.... bad idea!
Sorry couldn't help. @janner0814
*****************question on a TRIPLE ETF to $HACK************
@hawaiianmaxx: (6/15/15) "$hack is an etf not sure if thats what your looking for :-) @am"
@am: (6/15/15): "Hi Everyone, is there any leveraged Cyber Security ETFs? like a pro or ultra or it doesn't exist yet? "
Thanks @Tricia for all you do and hope you are doing well. I don't know much about biotech $IBB, however, I do have a few ideas about volatility and catalysts http://i.imgur.com/A2DXJHu.jpg . Hope you find some use for both graphics.
..........(BTW, this graphic was made on Friday 6/12/15, before all this "weekend #GREXIT news" came out).
Legend to the linked graphic:
Dollar sign.. = Released Dividends
Light Bulb... = Earnings Release
Torn Sheet... = Stock Split
Monday's open will be interesting, since "the open will come with" a total of 36 Stocks with dividend releases of Sunday (15: 6/14/15) and Monday (21: 6/15/15). For the unaware, non-possessors of the regarded dividend paying stocks, it'll appear as a price drop, when in reality it's simply a dividend release. However, as you know, stock charts don't always take these matters into account; at least not always "immediately."
So the "risk perception" could be heightened; as noted by the "enclosed graphic" (made also after market on Friday 6/12/15).
.........Have a nice day!
@TRICIA (6/14/15 11:42 PM): "$BLUE - as advised the EHA is ongoing in Vienna and BLUE announced data for a few[edit] patients. http://www.wsj.com/articles/bluebird-bio-early-study-of-sickle-cell-gene-therapy-appears-encouraging-1434187804?ru=yahoo?mod=yahoo_itp
Expect chatter re valuation and lack of larger data pool. A Fuerstien likes one - I don't know what that means
LONG -- and I may sell into profits if this opens at $200 ..."
6/15/15 7:15 AM: For anyone interested seeing a graphical view of my $TNA and $SVXY trades; please look at the enclosed graphic.
http://i.imgur.com/eBZcqXW.jpg
The "key to my method" is being mindful of what's going on with the market.
http://i.imgur.com/A2DXJHu.jpg
Needless to say, I do spend some time prepping for the upcoming week. 90% of my getting ready for today's action was already done four days back.
6/1/15:
Even though I'm anticipating and readying for
a "temporary retreat of the bears" for tomorrow's open; and the IYT
might be bottoming; I'm trading "nimble." Looks like we could get a nice
(transient) spike for the IWM & TNA tomorrow.
However, the "looming caveat:"
However, the "looming caveat:"
- Friday, May 30, 2015: 21: # of Stocks Up >= 50% I've learned to respect the "tell" of this stat. i.e. high probability of pull back when the "junk flies... (Pradeep quote (from years back). And the pull backs of late, have been compelling and violent; lasting, one to two days.
- Also, the BPNYA continues to expands to the negative between price and its 8 EMA (-0.43 today; -0.28 Friday; -0.25 Thursday). When there's this type of divergence, there often some nice price swings.
- "Don't be overly long or short during these inflection phases. Excellent opportunity to make good money, being "nimble.""
- So, be both long & short... and most important, take your profits; especially when the profits are large (take off at least some of it).
5/26/15 1336pm HST: Momentum indicators bulging negative. On my benchmark the five day sum of negatives = -32%; did go as low as -34%. Reversion to the mean IMO imminent. The CBOE PCR oddly rose to 1.14. Friday, it was 0.89.
* Journal entry: Be cautious of the "big money" fake out to the downside (i.e. bear trap).
* Market profile with a "letter b" on the IWM and SPY. Traders appear to be getting "overly short."
* This is the territory for a short covering rally. Looks like the sellers running out of bullets, for now.
Keep in mind the transports continue to show weakness. [JETS FDX IYT UNP](http://finviz.com/screener.ashx?v=211&t=JETS,FDX,IYT,UNP). Until Friday, the Shippers was holding up ok. Today, however, even [SEA](http://finviz.com/screener.ashx?v=211&t=SEA) displayed weakness.
http://i.imgur.com/lPQEfQB.jpg
p.s. Check WDAY after market.
5/18/15 10:39 AM Monday: Problem was I was too eager to short. I have noticed a pattern that occurred last Monday also. Today I got short way too early. My Current delta is -262.53. Why is it so low? Because my +25% bdf three day sum. The bears are not getting paid. The bears are indeed getting frustrated. The Russell is the bomb right now. The Russell gained the most today +1.21%. i.e. +15.10. The ES gained 7.75 or +0.34%. The NQ gained 19.25 or 0.43%. That is exactly the profile of bullishness, i.e. the speculative stocks are leading the way.
5/14/15 00:05am Thursday: Big day of the week.
Seth nice read. Perhaps not a "bearish doji sandwich," which is a powerful bearish signal; however, your read is spot on.
BTW sorry for being put off-ish. I am easily enamored by charts, and have proven to myself that I could become so enamored with charts, that I'd be letting my profits fly away into the sunset. So I've made a commitment to get better at managing this behavioral quirk. Regardless, sorry.
I did some quick guestimation eye ball reads on $EOG. Currently we're about -8.94% from the EO April 2015 highs (please bear with my "soft numbers"). Similarly with regards to EOG's historical down trend, I found $EOG's price action very interesting, between the time period of 2/17/15 to 3/13/15, the accrued loss was -11.50%.
So here's the question, that I found provocative, while handwriting my note to myself. Let's see what management does about the $86 level. Will they initiate stock buybacks perhaps? We'll see.
Hey thanks for your great ideas. I'm simply working on age old bad habits on my end.
@Seth: "Look at the last three days on $EOG daily chart excluding today. Not sure if there is already a term for it but I've been thinking of it as a bear sandwich."
janner0814 wrote:
Seth nice read. Perhaps not a "bearish doji sandwich," which is a powerful bearish signal; however, your read is spot on.
BTW sorry for being put off-ish. I am easily enamored by charts, and have proven to myself that I could become so enamored with charts, that I'd be letting my profits fly away into the sunset. So I've made a commitment to get better at managing this behavioral quirk. Regardless, sorry.
I did some quick guestimation eye ball reads on $EOG. Currently we're about -8.94% from the EO April 2015 highs (please bear with my "soft numbers"). Similarly with regards to EOG's historical down trend, I found $EOG's price action very interesting, between the time period of 2/17/15 to 3/13/15, the accrued loss was -11.50%.
So here's the question, that I found provocative, while handwriting my note to myself. Let's see what management does about the $86 level. Will they initiate stock buybacks perhaps? We'll see.
Hey thanks for your great ideas. I'm simply working on age old bad habits on my end.
@Seth: "Look at the last three days on $EOG daily chart excluding today. Not sure if there is already a term for it but I've been thinking of it as a bear sandwich."
Full Disclosure: This post intended for TA types.
Just watched the first few minutes of Dan's FAST. Got a few "aha" moments watching it.
Check out the pattern recognition: http://i.imgur.com/1DSdwLz.jpg. On the chart to the far left, I see $TNX with a bullish, inverse head and shoulders pattern. Which makes sense to me why the Financials have been on the upbeat. Oil $ERX, has done it's shake out of weak hands, aka: double bottom (2nd "v" is the shake out of the weak hands).
Full Disclosure #2: Pattern failure can occur; and from pattern failure often comes VERY powerful reverse moves.
And last but not least, the $IYT, as noted in a previous post had a very odd configuration. I've decided on a name that I'd shared with a few trading buddies, i.e. the "bearish odd couple."
http://tinyurl.com/bearish-odd-couple
5/13/15 05:02 AM Wednesday: OK, the TNA 10:30 AM EST 30m candle closed bearish, confirming the PRIOR, bearish doji decision. Let's see what the short term traders (STT) have in mind. Probably move up to bull trap, ADHD type buyers.
IMO this bearish dip, is a short term Market Maker ploy for today and perhaps tomorrow, to shake out the long TNA, aka: "liquidation break."
Remember STT respect the technicals, unlike the long term, institutional traders, who'll just buy based on "value, usually at the 50 DMA."
Our best TOOL that no algorithm can match: TIME. And time's best method: Patience.
5/13/15 02:20 AM Wednesday: In reference to my comment yesterday about being in balance, in particular, with regard to the TI-05 in TC2000?
* (sorry @thermos) However, I will provide the graphics so I hope this helps.
Balance from yesterday and the day before finally showing up in the TI-05, i.e. consolidation to the 100 number (surrounded by the blue rectangle)
OK, yesterday's note:
* Noted that [Monday 5/11/15 was a Market Profile balance day](http://i.imgur.com/z1DLL2r.jpg). you'll notice that the TI-05 was consolidating around the 100 level.
http://tinyurl.com/20150512-ti05-consolidation
Interesting that the [TI-05 lagged ONE day to Monday's Market Profile "balance day](http://i.imgur.com/j48aWkV.jpg)," i.e. it's showing the consolidation to the TI-05 level, I had alluded to yesterday(in regards to 5/11/12) This is an example of the confluence of signals that exists in different platforms.
I am sure there are many of you in Stockbee has noticed this.
I find the correlation to the Market Profile (& most probably in many other types of indicators), that a readiness move is impending. Which way, I'm not so sure.
* The market is throwing us and incredible amount of *mixed signals.* Best not to be either too long or too short, but perhaps to have positions on both sides of the ledger.
5/12/15 12:51 AM Tuesday:
Dan, nice and very generous free video on the $IBB.
http://stockmarketmentor.com/2015/05/some-thoughts-about-biotech-may-11-2015/
BTW, here's my simple method in dealing with issues related to those you'd covered with $JUNO. I have found this method valuable and psycho-saving. And I've covered this several times in the Forum.
http://tinyurl.com/IHTRC-the-EXIT-Signal and its partner: http://tinyurl.com/IHTRC-the-Acronym
http://tinyurl.com/IHTRC-more-than-a-WOE
"I HATE TALL Red Candles." I get out if any of my stock exhibits such a price behavior. I've made links to cover the rationale, i.e. there is usually follow through because of its accompanying volume. And the IHTRC criteria is that it's either coming off a high price point, or out of consolidation. And a IHTRC is ALWAYS the FIRST large red candle. It may follow a few small bodied candles.
It works very well for me; and for me at least, it works much better than stops, since there is a minimum of price erosion to the stop target. (Rule #1: "Don't Lose your money." Rule #2: Don't forget rule #1 (Warren Buffett)).
BTW: Can one call tops and bottoms? Just saying... for me perhaps can I call the shorter term reversals and inflections?
Yes. At the very worst for the topping inflections, I'm early by one day at worst.
Click on my name, I do not delete posts that I'm passionate about; I'll do overwrite the ones that I want a specific member to receive as a thankful gesture (such as this one). I have disagreed with the continued bearish comments on the $IBB on 5/6/15. And the $IBB stopped downtrending.
Yesterday, I went bearish.
Previously, when first starting SMM, I was about 4-5 days early. And being early is my "nature." However, now at worst for a topping inflection point, perhaps one day (lately). The bottoms are lot easier in this bullish uptrend. I anxiously await the bear market. IMO (& just saying) I'm getting better and more confident in making the trades related to my calls, i.e. I've transformed my method into fully, actionable trades. Not trying to boast; perhaps self promotion, which I despise... just a journal note commenting on my process of growth.
So what's my process?
1) First and foremost, my Momentum spreadsheet, which I've occasionally shared; however, there doesn't seem to be much interest here, so I've stopped sharing it.
2) I've kept myself media ignorant; no CNBC, Bloomberg, Zerohedge (Years ago, I used to be a "Zerohedgian").
Side note on media: Emotions and impulsiveness can be very disabling in decision making. This is related in part to the limbic system in our brain. So as a result, I've become my own news system, i.e. becoming EVEN more committed as a market observer and hand writing all observation (objectively). I'm writing more than looking at the screen, which is a positive. I may write 5 to 8 pages of hand written notes each day (two columns per page). And, there's also the virtual notes that I type (I'd rather hand write... much more natural to me).
Side note #2 on media: Nice long insight commentary on legal market manipulation and a subsequent video on the topic by Jim Cramer:
Using CNBC and Bob Pisani as ploys. http://tinyurl.com/traders-use-cnbc-as-a-tool
3) Increasing to trust my process and my instincts. My research and opinions may not always agree with Dan's. And that is "besides the point." IMO, Dan's vision is for each of us to go beyond the mentoring process and to develop one's process. After all, as I once commented to another member here:
"Aren't we all being mentored to develop our own prowess?"
5/11/15 8:43 am:
Jay, just doing the inside day group. Way past
my bedtime. Using only the first five on your inside list; cross
matching those symbols, as a process on my end.
Purpose for me: Attentiveness, keeping my head up on rotations into both sectors and stocks. Lately, the rotations have been more stock related.
******************************
On my end, my Watchlist criteria:
Liquidity: >$20 >1 mil stpd;
WKLY options;
Uptrending: MONTHLY, Weekly & daily;
(I added MONTHLY tonight, because I want the consistent heavy lifters)
Cycle bracket: Weekly upticking.
My watchlist Match to your Inside day:
1) AMCX (Media CATV Systems Subindustry ):
CMCSA: MONTHLY and Weekly uptrending. Daily very choppy and consolidating at best.
(no hits on ABC & ABG )
2) BSFT (Computer Software & Services Subindustry ):
MBLY (I currently own)
FFIV (FFIV is on the fence of my AVOID LIST).
Thanks.
@Aragorn: "Inside Day ABC ABG AMCX BSFT...."
What's the probability of a TNA rally for the rest of the day?
Well it could, except there is too much inertia above it. TNA has performed admirably the past few days. It needs some consolidation time. The 10 minute chart has the Gray(3 EMA), Lavender(5 EMA) Pink(8 EMA) Magenta (13 EMA) and Red (21 EMA), all weighing on TNA. The wedge is happening right now. Check your 10m chart (the aforementioned pressing TNA into the 50 SMA.
5/10/15 12:13 PM Sunday:
My weekend Process (for newbies only):
Step One: Do my
scans & process. Screen my picks per my method;
Step Two: Back test
and weed out the lower probabilities;
Step Three: Design my trades with either commons or low risk
option spreads; research the skews.
Step Four: Do a stock
specific search on #SMM (as to NOT let my focus be shifting)
Step Five: Review @Bridget do a match on my watchlist if not
"janner watchlist qualifiable."
Bridget, you mentioned $V and I almost took the trade... I
hesistated. Now I know better. Great prescient call. Love how you are willing
to just share your picks off your process.
@Bridget (4/28/15):
"$V is at a really low risk buy point right here. Sitting on the 50MA
after a nice pullback. Looks ready to run higher. Buy at $67 with a stop just
under $66."
@tnt Must admit you've got an early eye for stocks. $CHK
could've been a very nice option trade in retrospect. As for $YELP, it's not
very popular it seems. I wouldn't worry about it. I like the technicals. In two
days, it burst above the 3,5,8,21 EMAs and the 50 SMA. Two solid days of
>30ma. I personally am looking at $YELP on a pull back this week.
Don't let anyone tell you otherwise. Your process has merit.
I'm simply searching the site of symbols that have that momo. You are early,
like I often am. However, IMO you are spot on here. Good stuff and keep it up.
@janner0814
@tnt: (5/8/15):
$TWTR chart https://www.tradingview.com/x/kGSro0Ys/ $TWTR higher out of bullish
falling wedge in wide channel off support.
When I first entered the $COP,
there were a few here that didn't agree with my choice. That was fine. I think
even the video was bearish on $COP. Hey I do my own process and the trade is
mine's. I got talked out of a $CHK trade, by taking AWAY trust from MY OWN
process.
psyc, sometimes noise is ok;
however, I do better without it. I'm profiting on $COP on both the capital
gains and short calls. Then I'll lighten up when it tops.
$COP is very predictable (for me at
least)... my dog (pictured) could trade $COP.
http://tinyurl.com/COP-LONG-janner0814
@psyconline: "(5/8/15):"
$COP Noticed a Tweet informing of "massive Call buying of $COP at June
72.50" - if the chart sets up well, does the Fitz model give much
credibility towards unusual options activity (like the Najarian brothers and
others)? Thanks.
Perhaps a weekend glance or read
(this is a pdf download).
http://tinyurl.com/NACM-Report
Just information I like to be
aware of. I set memos to myself to look over these CMI reports each quarter.
Yes, this is Fundie stuff and I'm 95% TA; however, I do read stuff outside of
my charts; especially reports that is one to two steps away from the
interpreters of info, e.g. CNBC, Bloomberg, etc.
FD: (for newbies) These credit
reports are IMO historical and always in revision. What I look for are key
divergences or things that "jump out at me, relating to my TA."
This is information; not
necessarily that you could trade on. "API"(Market has Already Priced
In). However, IMO, it's is info that all traders and investors, "need to
be aware of."
Got a note that a member suggest
that I post the general URL. OK. Also a graphic on how to get the report.
http://www.nacm.org/cmi.html
http://i.imgur.com/EecXtbK.jpg
(local upload not working)
@janner0814
I'm searching the site on a
symbols only basis. And just off my journal. $ISIS may
be having some volatility going past earnings. I expect some positive moves per
my cycle analysis come the latter part of the May.4 week. The upcoming move
(yesterday & to Tuesday) is IMO just the beginning***; i.e. possibly the
first of two moves, I'd wait for the second move. I may just scale in with a
measily 5-10 shares or do a tight May4.wklys ITM bull call spread. My best
trades comes from trading reconnaissance. Once I'm in the trade, I manage it
with my ears closed, eyes on the chart.
***Currently, a wedge is being
formed by the SUPPORTING and uptrending 3,5,8 EMA towards the flat 21 EMA. I
would think that if it gets past the 21 EMA, then the next OHR is the 50 SMA
just over the $65 level.
Here's where it gets
interesting. What often happens is the
market will pull back, shaking out the weak holders of the stock. And thereby
forming a "pull back." If that happens, it sets up the potential
for a double bottom.
FD: Patterns can fail... keep an
eye on volume in the coming 1.5 weeks. When I enter I'll try to remember to
post on my entries (Actually I have my bid out; matter of time on when it
fires). However, you are doing fine on your own. Avoid paying too much
attention to bearish comments that seems to pervade the thread of late. I
have.@Lou
Hey Jay, sorry for your having
disrespectful neighbors. Doing my usual Aragorn Subindustry matches of your
Inside Day'ers.
Just following my method for the
two #SMM members that I follow.
So here is the process that I'm
following for your "ATHM," , i.e.: Subindustry: Internet
Informational Providers (IIP):
1) Cross matching (IIP) stocks
against my watchlist (>$20; >1 mstpd; WKLYS Options).
2) Weekly & Daily uptrends; if
no weekly uptrend, then 2a) below:
2a) If #2 is not satisfied, there
must be a clear reversal signal for a downtrending issue. Will be on my
"Interesting List."
3) Must satisfy an upward cycle to
improve the probabilities on my end (as determined by my cycle bracket drawings);
So the next step is screening
further.... first using the weekly chart, then the daily. Included are the
"finalists," with my comments:
Uptrending Weekly:
$AKAM (this is on my avoid list...
I don't do well with this stock)
Day Chart: Bullish "J- Hook
Pattern." Unspectacular volume. Melt up candidate and as I call it on
"stealth volume."
$YNDX: (Weekly Chart): Looks like
it's ready for a consolidation period to digest recent gains.
Day Chart: This could just be
developing into the "old Bullish Dragon pattern." Too much of a
"snout" to being a "J Hook Pattern."
Uptrending Weekly/Pull Back:
$YHOO: (Weekly Chart): This
consolidation IMO is what I call the Bullish "J-Hook Pattern."
Positive, unspectacular GREEN wkly volume candle.
Day chart: Day two following
Thursday's "bullish kicker pattern."
$JD: (Weekly Chart): Consolidation,
pull back. Nice weekly.
Day Chart: Unconfirmed bullish
engulfing pattern. I'm watching this with caution, because of the confirmed 4/27/15 bearish shooting star.
Don't want this fine stock morphing
on me, into a HS pattern.
Non-uptrending Weekly Charts: Out
of Consolidation:
$GOOG/$GOOGL: (Weekly Chart):
Consolidating; coiling; volume receding... something's about to happen.
Day Chart: Bullish kicker...
kicking the sh*t out of the shorts.
Day Chart GOOGL: Bullish kicker;
potential doji sandwich on Monday (with a large body green hollow candle?)
Non-uptrending Weekly Charts:
Reversal Potentials from previous downtrend:
$YELP: Weekly Tweezer bottom; two
HUGE Green candles volume>30ma. Day Two of Dan's three day rule. Could spike
one more day, before a consolidation? Whatever, the case, I would NOT fade this
VERY powerful move
Day Chart: "Rip your short
face off rally!" on Thursday and Friday. Shorts are VERY distraught.
Aragorn (5/10/15): "IBD 50 ....Inside week - ATHM ...."
5/8/15 3:52 PM Friday: Very interesting discovery the
back to back <80 Put-call ratio: on opening
range:http://i.imgur.com/hWtx6zr.jpg
This gave the clues on the back to back surges. Possibly even a third
day.
5/5/15 08:26 PM Tuesday: Given momentum, we could get a quick fast move (failed short term bearish move... short term traders are in control of the market).
So my short term price target using the 30m chart; to either the 50% or 61.% fibs. We were dickering at 80.88 inside of an hour to close; then we surged. Short
sellers took profits. However, the PCR is at 1.24 so the bears are hedging the open. I initially thought that Bears are selling the close. This might be more of a hedging the open with a ton of puts. VIX up 11.36% at 14.31 + 1.46.
http://i.imgur.com/vUTiRt9.jpg
5/5/15 Tuesday: Thus far T N Eh is taking a beating possibly on something that is happening in China. Perky stocks in China took a big breather overnight, with the Shanghai Composite tumbling 4.05%. The Hang Seng was off 1.3%.
Europe's modestly lower and U.S. index futures are down marginally.
The 10-year Treasury yield is down one basis point at 2.14%, gold is flat, and oil is up $0.55 per barrel to $59.49.
Mallinckrodt plc Reports Fiscal 2015 Second Quarter Financial Results; Raises Full Year 2015 Guidance
- Second quarter net sales up 63.1% to $910 million
- Second quarter adjusted gross profit up 120.4% to $615 million
- Second quarter adjusted diluted earnings per share up 81.1% to $1.72
- Raises guidance on full-year net sales and adjusted diluted earnings per share including the recent addition of Ikaria, Inc.
5/4/15 08:36 PM Monday: Just crunched the numbers, there might be another surge. BTW the tf futures and the tna pcr were both light, although the es and /nq were in the 2.7; 2.8 respectively. tf and tna were respectively 0.228 and 0.631.
5/4/15 09:14 PM Monday: It looks as though $CYBR $FEYE $SWKS
Per prazan's 12:12 AM 05/05 earlier note:
$CYBR Anyone interested in buying shares on a dip might prepare for that dip tomorrow. The $QLYS miss will probably ripple out to hit other stocks in this general sector. $CYBR reports 5/7, so be aware of how that might affect share prices over the next three days, and your plans to hold or fold before earnings. I'm likely going to hold, barring a meltdown. I'd like to add, but perhaps not this close to earnings.
Remember, greenghost; ignore his posts just as he ignores, hwyflier. Ignore the asinine posts of the stbee idiots; don't contribute anything to pradeep's a-holes.
5/4/15 08:42 PM Monday: Interesting the diversity in the level of trader consciousness in smm. I will not even bother to address this comment because it's a complete waste of my time and resources. I am learning.
From SMM: jblomita under the heading: "already factored in:"
$WFC City of L.A. Sues Wells Fargo, alleging 'unlawful and fraudulent conduct'.
#page=1" target="_blank">http://www.latimes.com/business/la-fi-wells-fargo-suit-20150505-story.html#page=1
5/1/15 1:54 AM Friday:
1641pm: Excellent day of trading. Here is the link for the calendar for next week. I don't want to overload this website. And I've given ppl the link for the Bloomberg Calendar.
http://i.imgur.com/ylOsR44.jpg
BTW Pradeep is still an ass, however, both he and jrob have to tolerate me for another year. I paid for my subscription and I might not want to reup; why am I paying for his shit. He's bull shit. He's fkg racist.
05:55am: The MM gave me a clear signal of the impending reversal. My Big money indicator showed that the short term, big money (not institutions, was ripping the dip buyers.
Here's a link that I'm sending to a media friend. http://i.imgur.com/ehiVMe3.jpg . It's a confirming signal to the MM, of what the BIG MONEY Short term traders were doing, just at the close yesterday and how they FLIPPED, in the 15 minutes of futures trading. I've labeled it A B C.
The FLIPPED was closing their shorts on the /TF (Russell Futures). So I made the right call buying calls near the $TNA bottom. So today will probably, easily reverse the 1.3% loss of yesterday, I'm still up 19% for the year. (Darn!)
I'm better, thanks.
Also Pradeep keep an eye on the margin on the BPNYA & whatever EMA you use. If it appears to contract, then stay put with your long positions; these big money, short term traders (not the institutional big money are just shaking out the weak hands)
Otherwise, use the opportunity to hedge your winners via short calls 1-2 strikes up near the close of the day DTE7.
Valuable lesson: I've learned NOT to share my money making ideas on Stockbee. Sacred cow, trader wannabee.. no thank you. I'm back at my hybernation mode; so I'll write you directly.
Bye (to Pradeep).
4/29/15 2:24 AM: Pradeep is such an ass. Well don't post any more posts. You are done. Please use me instead? :-) Fck that asshole; send his ass back to the far east. He's a charlatan. He is so passive. No guts; Mark was right. He lacks the balls. OK he responded back. Need to check on my trades.
4/29/15: So I called the market right by shorting calls. Very important to stay in tune with the market. All of you help me so much. Have your watch list ready; remember ckbergin is one our most SUCCESSFUL investors!!! next few days will be
4/28/15 10:55 AM: mambapete gave me an idea to look at the rails and TRN looks as the best candidate of my watch list. The only one with a positive day today with a potential morning star doji. R/E was 4/23/15 with $1.13 beat of a 99c estimate; overcoming the "rail gate death."
Aragorn likes WAL: Western Alliance Bancorporation. Looks to have a tough to MidMay. Put it into my calendar. Also just put OCO Bids on NKE May4.15 OTM spreads (104/107 for 19c). Tired need to sleep! Looking at ARagorn's recommendations.
4/24/15 02:57 PM Friday:
20:59 PM: Doing some of the TNA extrapolations. Making the Closing orders for both stocks & options. Everyone believes there is room to go to the upside. I think we're headed for worse situations. The key for me is finishing the spreadsheets.
16:59 PM. I'm back! I'll just journal here. Today, I was caught in 1K of TNA. I lied on stockbee. I overposted and insulted bluesky. Also pradeep is taken aback. However, regarding the market it looks that the market has abdicated the Monday, April 27, 2015 open, with a PCR of 0.76. This is a notable drop from Thursday 0423's 1.03.
There is a clear concern however, we've hit the >19 level on the Stocks up 50%+ in one month. Definitely a bearish signal. It usually takes about 3-5 days for it to actuate.
This is from 10/14 to 11/14? perhaps? My Journal: Archive it Every month: 9/14/13
Saturday, November 16, 2013
11/16/13
12:00 AM: Haven't visited you for a while since the computer issues. Now that
I've gotten the imaging done, I'll be a more regular visitor.
Interesting! that two for the
three new highs-lows: are turning negative: without $NHLSPX. Keep an eye on the
"sum" since the 114% could be an "inflexion point" towards
the upside like it did with Oct 9, 2013.
102, 127, 132 117 then: 9 to 10 consecutive days up> 134%

Thursday, November 07, 2013
11/7/13 12:23 PM: The wonderful commodity channel
index on the 65 minute chart.1) Notes the "vertical moves as noted by the blue ovals.
2) Also take notice to the repercussions to the price action of the second "v" of the double
bottom, i.e. an accelerated continuation of prior downward, price action.

Tuesday, November 05, 2013
11/5/13 3:50 AM:
Speak clearly, if you speak at all; carve every word before you let it
fall. -Oliver Wendell Holmes
By the way!: from redoption:
11/5/2013
U.S. equity
futures are pointing to a lower open. There is little for investors to get
excited about after the market reached record territory once again. The
earnings season has passed its peak and little economic data is due to be
released today. The only major data point due out is the ISM non-Manufacturing
report. The report is due out after the market opens, and analysts are
predicting a reading of 54.0 which is slightly below the previous reading of
54.4. The CBOE Volatility Index (VIX) traded lower yesterday as stocks traded
in a tight range higher. With no catalyst to affect equities, we could see
stabilization or continued grind higher for stocks. Complacency is high
and volumes are becoming anemic as stocks are near all-time highs.
Treasuries
are weaker amid declines in Asian and European bonds. The yield on the 10-year
Treasury edged up to 2.62% again, where it's stalled out for now. Trading is
cautious ahead of Thursday's European Central Bank (ECB) decision and the U.S. October
employment report on Friday. A stronger than expected U.K. services PMI (hit a
16 year high) more than offset disappointing retail sales, while Euro-zone PPI
decelerated to -0.9%. The Australian Central Bank kept it policy rate
unchanged, as expected, and retained its dovish tone. Traders will monitor
today's October ISM services data for any spillover effects from the shutdown.
Risk is the service sector held up relatively well. Traders are also looking
ahead to the Advance Q3 GDP (Thursday). There is also more Fed-speak today from
Lacker on labor markets and Williams, who will be speaking to reporters at the
SF Fed's Asian conference.
Stock
Stories:
Michael Kors
(KORS) – Zsa Zsa – The upscale retailer posts better than expected
top-line revenue and EPS numbers this morning. The company sees Q3 numbers
lightly ahead of expectations as comparable store sales are trending above 20%
growth. The stock is down slightly ahead of the opening bell and is only
3% below all-time highs.
CVS Caremark
(CVS) –Spending – The retailer reported blowout quarter this morning as
store traffic remains high. Shares are up over 2% in the premarket and
have risen 30% for the year. .
Major
Economic Reports:
6:45 am CT – GS Store Sales - Down 0.6% for the week
9:00 am CT – ISM Non-Mfg. Index
11:30 am CT – Fed’s Lacker Speaks
4:10 pm CT – Fed’s William’s Speaks
Notable
Earnings:
Before Market: AMED,
AOL, COCO, CTSH, CVS, D, DTV, EMR, EXPD, KORS, OMX,
TRP
After Market:
AGU, CBL, CHRW, DPM, FOSL, MYGN, PZZA, RGR, TSLA, VVUS, Z
Wednesday –
11/6: AGU, CBS, CHK, DVN, HSP, HUM, MDLZ, PRU, QCOM, TAP,
RL, TWX, WFM
Saturday, November 02, 2013
11/2/13 9:16
AM: building on my earlier ideas, this is
the October

Friday, November 01, 2013
6:31am 11/1/13 Friday: TNA just wants to fly from here. Currently it's bid is at $6.03; my bid is $64.91. I'll close this by 6:42am.
11/1/13 6:15am: Sold this Nov4 63 Put for $2.29. So I would net 39c; i.e. $36. Not about holding as much as turning around profits. And this particular turnaround is simply a day order that closes after today.
11/1/13 6:15am: Sold this Nov4 63 Put for $2.29. So I would net 39c; i.e. $36. Not about holding as much as turning around profits. And this particular turnaround is simply a day order that closes after today.
11/1/13 6:11am: Trying to close my LONG 500 Shares of TNA; while also trying to get short on the Jan14 TNA Calls at 10.90; jic insurance type. Per vbbee's sell on strength.
11/1/13 4:16
AM: 4:16am stats:
11/1/13 4:06 AM: Here is the 4:06am
bsky stats!
Wednesday, October 30, 2013
10/30/13
4:09 AM: More than likely this raises
my margin; however, I can probably get back a few cents on the losses. currently at: AKAM $45.77; the Nov13 43 Put is
at 17c; I want 30c which brings AKAM to $45.01; the S2. support.
10/30/13
3:48 AM: 10/30/13 3:41 AM: Completed
the CIEN transaction, i.e.
1) Sold the CIEN Nov 23 Puts x 6 -51c.
2). BOUGHT CIEN Jan15 25 Calls x 6: $4.25 ($3.74 basis?)
10/29/13
4:41 PM: If you own CIEN; then you
need to sell near term safe calls; just in case, to be on the safe side. there
is another ^ for the 2nd portion of the double bottom: Brings down your basis
even further.
Friday, October 25, 2013
8:45 am: 10/25/13
Friday: SOSNOFF SAYS
It’s been a really interesting week, as many stocks have
jumped 10% to 15 % for simply not reporting bad earnings. Yes, it’s crazy! But
you probably still want to know who is buying all these stocks at record high
prices. Well, to paraphrase a famous quote, “putting those decisions in the
hands of people who will pay no price for being wrong is stupid and dangerous.”
But no one cares until somebody draws blood. The science of successful trading
is recognizing practicality. High margin balances and zero cyclicality are not
practical.
10/25/13
7:13 AM: Here is my sequenced TNA trade selling the Nov1 68 Put (next week’s)
for 95c
2) Then even lower for TNA pricesellg the Nov1 67 Put for
78c
3) Then go south on the puts, selling the Nov1 69 Put for
$1.60.
Anything
can happen! And this requires the Market to drop today!
This is my layering concept of selling TNA further out, then
further out (i.e. shorting puts), then after reviewing charts; come back closer to the
money

10/25/13
4:03 AM: Looking at next week’s PINS
on AMZN open interest: highest at:
340: 1,395 Volume (184).
360: 1,227 Volume (open interest: 524)

Thursday, October 24, 2013
10/22/13 10:48 AM: If this trade goes thru, I’ll buy the Jan15 115 Call for $3.80 (6.00 price with 2.20 credit selling the Nov4 65 Put for 2.20).
SELL -6 QIHU 100 (Weeklys) NOV4 13 65 PUT @2.20 LMT GTC SUBMIT AT 10/23/13 09:05:00 CANCEL AT 11/25/13 14:44:19 / BUY +6 QIHU 100 JAN 15 115 CALL @6.00 LMT GTC TRG BY #628581780 SUBMIT AT 10/23/13 09:05:00 CANCEL AT 11/25/13 14:44:19
10/24/13 1:02 PM: Dang what do you think of this? 5002 Nov1 WKLYS calls at
the 75 Strike? Is this person planning
on selling calls below it? On Friday?
10/24/13 10:51 AM: WYNN missed earnings! Using previous fibonacci level. from peak to light blue 50ma VWAP, i.e. $101.64. I would buy calls if WYNN were to reach this level; i.e. semi LEAPs 12-20 months back.
10/24/13
10:29 AM: AMZN Smashed EARNINGS!!!
What could I have done different? Well how about an “a bull call spread
on the LEFT” and a broken wing butterfly on the RIGHT? OK no broken wing butterfly, simply the bull
call on the right; since the charts showed a positive bias.
Then if Market opens, you buy another call at the strike
below it. This is the only change that you would do. And you could do it since
you had one more day left in the week!
10/24/13
9:07 AM: here is my AMZN IC trade:
- ..Selling the 390x395 Call spread
- ..Selling the 285x280 Put Spread.
- Whatever the direction AMZN goes is the spread that I will close.
- There is resistance at S3., i.e. $366. on the WKLYS chart.
- So if AMZN spikes up! close the ONLY the Short Put.
- Keep the Bear Call Spread TIGHT & intact JIC; remember how the black swans search for short calls with TOS’s help near expiry.
- If AMZN spikes down.
- Then Close the Short Call & Perhaps short another Put just below, to uneven butter-bull put spread it.
- Close the Long Put ONLY when value starts to come out of it!!!
- Then on the Call side, as premium builds up. Sell a call either just to either bear call or bull call spread it by one strike.
- ...SELL -1 IRON CONDOR AMZN 100 (Weeklys) NOV4 13 390/395/285/280 CALL/PUT @.68 LMT
- 10/24/13 8:42 AM: Closed CREE short Jan 15 77.5 Call (Opened at $6.85; closed at $6.65 for a 20c profit =17c less comm.).
10/24/13
6:10 AM: Here is a low ball NFLX
Jan15 350/355 Call spread for 1.81; the bid is currently at 1.98. This bid ends
on 11/2. Anything can happen!
10/24/13 6:10 AM: Here is a low ball NFLX Jan15 350/355 Call spread for 1.81; the bid is currently at 1.98. This bid ends on 11/2. Anything can happen!
...BUY +1 VERTICAL NFLX 100 JAN 15 350/355 CALL @1.81 LMT GTC CANCEL AT 11/2/13 11:09:56
10/24/13 6:04 AM: Hopefully I can sell this loser long put by friday. Otherwise I end up making 11c per spread for 3 spreads, if this expires worthless.
..SELL -3 AKAM 100 NOV 13 43 PUT @.54 LMT GTC
10/24/13 3:18 AM: October 24, 2013
Posted by preznicek at 9:08 AM on Thursday, October 24th, 2013
Good MorningValue areas and POC figures for /ESZ3 and /NQZ3 are posted free every morning HERE.
In context of longer timeframe, yesterday’s “selling” and I emphasize those quote marks was rather lackluster. The market felt like it was just getting itself overly short all day and got nothing much to show for it. As such the range was compressed which should bring opportunity today. Think: contraction leads to expansion, and vice versa.
The first thing that grabbed me this morning when looking at the profile is how high into Tuesday’s range the overnight session probed. Futures went as high as 1751.75. Even now at 9:00am EST, although well off the highs, the futures are still within Tuesday’s value area.
Overnight inventory is almost 100% net long.
The POC yesterday was very prominent with only one period at the end of the day not trading at the 1739.75 to 1740.50 level. These four levels are the widest and also have the volume POC within them. Together with the low, the classic 45 degree line was formed. This pattern indicates a market that has gotten itself overly short, thus the slight gap higher today is of no surprise. The price action all day along with seeing this at the end of the day is what caused me to bring my stop on my remaining shorts to just above yesterday’s RTH session, which for now seemed like the right move.
Whenever you have a compressed range, you should be thinking of a larger move in either direction if it can take out the high of that range. Currently we are trading well above yesterday’s RTH high. If the market finds acceptance within Tuesday’s range today, then I would think of yesterday as just a small liquidation and the trend is intact. Downside acceleration could only begin below yesterday’s POC. Note how the ONL at 1740.75 stopped just a single tick above where those wide TPO’s begin. Coincidence? I think not.
Have a wonderful day….
peter
10/24/13
2:49 AM: four legged gann tops & four legged gann bottoms.
Also Oscar’s correct bearish call on TSLA: looks to me like a
head & shoulder formation

10/24/13 2:46 AM: SOSNOFF SAYS
There is a part of me that finds it interesting how Alan
Greenspan is timing his book tour with interviews about relatively cheap market
valuations. He’s 87 and I don’t understand the need to compromise integrity for
ego. Maybe it’s a make-up call for missing the 2008 meltdown or maybe it’s his
farewell tour. Either way, his premise that investors are irrational in
predictable ways really just suggests that markets are pretty random. And the
bottom line is that it’s never too late for anyone, including Greenspan, to try
and monetize the consumer. Aside from being a great confirmation of price
extreme, the S&P 1750 level seems very close to a major top.
10/24/13
2:43 AM: 02:30 YSS: QE FOREVER!
02:30 cap:
continuing claims actual 2874K, survey 2870K
02:31 cap:
initial jobless claims actual 350K, survey 340K
02:31 Ben:
International Trade. -$38.8B vs. Consensus -$40.0B prior -$39.1B
02:32 Ben:
jobless Claims. 350K vs. Consensus 340K prior 358K
02:32 YSS: N
O T A P E R
02:32 Labyrintho:
YSS :)
02:32 cap: and
shockingly, markets are barely reacting to this number
Wednesday, October 23, 2013
10/23/13 7:02 AM: So if this trade goes off, I would be paying 11c each for the 3 USO APR14 37.5 Calls (91c). The USO 37.5 Calls is the second of two sequence/triggered trade. The first being Selling 3 ERX Nov13 68 Put at 80c each. This credit will be used to purchase the USO calls, unless I’m assigned.

Tuesday, October 22, 2013
10/22/13
3:45 PM: This trade is meant for me
to get PAID $1.76 for the CREE Jan15 80 Call.
CREE is getting hammered in the AH following missing ROE. Here is the
breakdown for my BLAST ALL trade:
1. Sell -3 CREE Jan15 50 Put @8.05
2. BUY 3 CREE Jan
15 80 Call @6.29
Day orders, “if it happens, fine; if it don’t no biggie!!!”

10/22/13 10:48 AM: If this trade goes thru, I’ll buy the Jan15 115 Call for $3.80 (6.00 price with 2.20 credit selling the Nov4 65 Put for 2.20).
10/22/13 10:49 AM: Although the double
bottom: did not form completely, the knowledge of it allowed me to hold the TNA
position past the drawdowns & to sell it at at 60c profit for the 200
shares for $70.10. J
10/22/13 7:11 AM: Interesting observation; as a double bottom was being formed on the 15 minute; TNA because indecisive about this time.

10/22/13 4:31 AM: The Worden Report (Monday, October 21, 2013)
Ho-Hum
Day on Wall Street
The
various major market indices closed mixed today, as the stock market shrugged
intraday losses to finish mostly unchanged. The NASDAQ Composite was up
slightly, while the Standard & Poor's 500 Index and Dow Jones Industrial
Average were virtually flat. Overall, today's trading was lackluster, but this
will be a big week for corporate earnings. Over twenty-five percent of the
companies in the S&P 500 are reporting this week. An interesting earnings
stat from Deutsche Bank points out that of the eighty S&P 500 companies
that have reported so far, seventy percent have beaten earnings expectations,
but only fifty-three percent have surpassed sales forecasts.
Gold
stocks continued their bounce today with the Market Vectors Gold Miners ETF
(GDX) leading most sector-based ETFs with a gain of 2.26%. It's far too early
to proclaim a bottom in GDX, but keep an eye on the potential short-term
"W" pattern which has been forming since the late June lows. GDX
closed today at 24.93. If the "W" pattern is to earn some
credibility, the 50-day price moving average, currently at 26.50 will need to
be surpassed. Today's leaders among the 31 component stocks of the GDX were
Golden Star Resources (GSS), up 6.82%, IAMGOLD Corp. (IAG), up 4.62%, Sibanye
Gold Ltd. (SBGL), up 4.07% and B2Gold Corp. (BTG), up 3.85%.
The
technology sector extended its advance today hitting another new multi-year
high. The Select Sector SPDR-Technology (XLK) added 0.54% bringing its total
gain from the October 8 low to 6%. Top performers in the XLK today were First
Solar Inc. (FSLR), up 7.82%, JDS Uniphase (JDSU), up 4.63%, F5 Networks (FFIV),
up 2.62% and Apple Inc. (AAPL), up 2.45%.
-Peter Worden
E-mini S&P 500 futures hit 1740 target, so what’s next?
-
- S&P 500, The Opening Print |
- In the August 19 Opening Print, which was part of the MrTopStep Fall 2013 outlook series, I wrote, “Regarding upside targets, I’m keeping my eye on 1725.25 and 1740 by the end of the year” for the E-mini S&P 500 futures (ESZ13.CME).
-
- Well, I guess it should come as no surprise that these bull targets were reached much faster than I had expected, as the market has ridden the bull train all year.
-
- What I find particularly interesting is the fact that my first target was reached at 1725.25 on the day the ES set a new all-time high at 1726.75, exactly one month after I wrote the article. As we know, the spoos sold off from the 1726.75 high and later rallied hard off 1640, which has fueled this recent rally to my final target at 1740.
-
- While I’d like to take credit for calling the market perfectly in this instance, I chalk it up to luck. But I’ll take lucky any day. I do believe we create our own luck, though. And I’m sure I wouldn’t have gotten lucky had I not done my homework that led to my forecasting of those targets. I can’t get lucky if I’m not prepared, and that’s why I do the work.
-
What’s next for the S&P 500?
-
 The E-mini S&P 500 Dec 13 (ESZ13.CME) futures
put in another year-to-date and all-time high at 1742.50 during
Monday’s trading, but the bulls weren’t able to advance the ball, unlike
what we’ve seen the last two weeks. Which prompts the question, “Are we
now headed lower?” In short, yes.
The E-mini S&P 500 Dec 13 (ESZ13.CME) futures
put in another year-to-date and all-time high at 1742.50 during
Monday’s trading, but the bulls weren’t able to advance the ball, unlike
what we’ve seen the last two weeks. Which prompts the question, “Are we
now headed lower?” In short, yes.-
- The ES has rallied 102.50 handles from the 1640 low in just 9 sessions. Try to find another comparable move in the same amount of time in the recent market. You’d have to go back to Q4 of 2011 to do so, which had a nine-day stretch that held a a range of 120.50 points. I guess it’s important to note that the ES retraced 60% of that move in the eight sessions that followed back in 2011.
-
- The daily chart shows the ES continues to trade within a clear channel that has developed since the very first trading day of 2013. The ES reached the upper trend line of this channel today at 1742.50, which means we could see another ride down within the channel over the next two weeks.
-
- As a matter of fact, given the slopes of the three declines that occurred off the upper trend line since May, a forecasted target range can be found between 1663 and 1668.50, which could be reached during the first or second week of November. Of course, another great buy opportunity could be seen heading into the end of the year if this scenario plays out.
-
Here’s the plan for Tuesday’s session
-
- So what do we do with the information above? Well, the first thing we have to do is watch the 1735 pivot. If price breaks below this pivot and then converts it to resistance, we could see a solid decline toward the primary weekly bear target at 1712.25. The 1717 level will also be a point of interest.
-
- If the 1735 level is defended and price breaks beyond 1740, it could be business as usual, as the market continues to trend higher until proven otherwise. In this case, the primary bull target to watch for the week is 1765.
-
- Keep in mind, a breakout in either direction could spark a major move Tuesday, as the ES traded in an extremely narrow price range of just 7.75 points Monday. Given the current 10-day average daily range of 22.50 points in the ES, a breakout in either direction could spark a move of about 22 to 28 points, so it could be a big day.

Monday, October 21, 2013
4:12am: TZA low ball buy of Oct4 Calls:


10/21/13
1:35 AM: Complex VXX Trade willing to risk $97.50 (i.e. includes commissions):
1) & 2) Totals Selling FIVE Oct4 16.5 Calls at 19c
(-1.25comm) = .1775 x 5 = $88.75.
3) & 4) Selling total of Ten Oct4 16.5 Calls at 25c
(-1.25comm) = .2375c x 10 = $237.


pictorial of the trade:
graph: with wklys
Sunday, October 20, 2013

10/20/13 4:12 PM: Hopefully not too complicated a trade. Buying the Nov4 55 call for 71c; then selling the Nov4 58.5 call for 1.21. So functionally, having a LEGGED 55x58.5 bull call spread (with at .50 credit). Finally, trying to CLOSE this trade for a $1.31 credit. So, I would make $131!!! When risking initially: 71c. Delta +12
C:\files\jpg\20131020 1619pm fb low risk trade $131.jpg
10/20/13
4:56 PM: A complicated TNA, thought
out ahead trade.
1. Closing the 3 Short Calls at the Jan14 59 Strike at 6.00
(net 4 left). (10.49basis
– 6.00 = $4.49 profit x 3 = $1347).
2. Triggering hopefully the close of 3 more Short Jan 14 59 Calls at $4.00 (net one
left); You may need to manually close these last three. ($10.49 – 4.00 = 6.49profit x 3 =$19.47 = $1,947 profit).
3. Triggering hopefully the close of final One Short Jan 14 59 Calls at $2.00 (net zero
left). You may need to manually close
this one. ($10.49basis
-2 = $849).
4. Triggers LONG buy of three (3) Jan14 60 Calls at $2.00
(unreasonable price however, the Market has shown you Anything can happen!).
5. Next to final: You close your original 7 TNA Naj14 60
Calls at 12.25. Making some money. (Previous profits + 12.25-$5.11 =7.14per x7 = $49.98 =
$4998).
6. Just have to close remaining 5 calls. Then begin opening
calls later in the year. June to August; see where the vol drops.
file:///C:/files/jpg/20131021%201700pm%20tna%20schema%20hopefully%20it%20happens.jpg

10/20/13 4:12 PM: Hopefully not too complicated a trade. Buying the Nov4 55 call for 71c; then selling the Nov4 58.5 call for 1.21. So functionally, having a LEGGED 55x58.5 bull call spread (with at .50 credit). Finally, trying to CLOSE this trade for a $1.31 credit. So, I would make $131!!! When risking initially: 71c. Delta +12
C:\files\jpg\20131020 1619pm fb low risk trade $131.jpg

10/20/13 7:51 AM: Currently you have the VXX MAR14 21 Calls at 77c each; at 68.5c; losing 9c. Your goal is for the VXX 21Call to hit >$2
Or the MAR14 VXX 22Call to hit >$2
Tuesday, October 15, 2013
10/15/13
4:14 AM: The Worden Report (Monday, October 14, 2013)
Stock Indices Close Near Their
Highs Following a Rough Opening
The stock market shrugged off early
losses to finish higher for a fourth consecutive session. After dropping 100
points on the open, the Dow Jones Industrial Average climbed higher throughout
the day to close at 15,301.36, up 64 points or 0.42%.
Investors began the day
disappointed that more progress was not made in Washington,
D.C. over the weekend. However, the word
now is that lawmakers are moving ever so slowly toward an agreement. Those
involved feel optimistic a deal will be struck by the end of this week.
The Standard & Poor's 500 Index
gained 6.94 or 0.41% to close at 1,710.14. The NASDAQ Composite Index was up
23.40 or 0.62% to close at 3,815.27, just shy of its multi-year high of
2,817.98, established on October 1. The Russell 2000 Index closed at a new
multi-year high of 1,089.98, up 0.55%.
Today's top performing sector-based
ETF on my list was the SPDR S&P Metals & Mining (XME), up 1.53%. AK
Steel Holding Corp. (AKS) led the thirty-nine XME components with a gain of
5.33% on Volume Buzz of +21%. AKS has regained its footing above its 200-day
price moving average in recent weeks and the chart looks good. The stock
appears poised to breakout above last month's high. Three individual component
stocks in the Russell 1000 Index, which ranked very high in Volume Buzz, but
closed down on the day were Morningstar, Inc. (MORN), down 1.19%, Expedia, Inc.
(EXPE), down 6.22% and Whirlpool Corp. (WHR), down 6.50%. All three of these
stocks are looking quite bearish on the charts. Heavy selling has begun to
weigh on shares of MORN in recent days. EXPE, of course, suffered a technical
backbreaker when it gapped down 27% in July. EXPE should soon embark on another
leg down. And WHR has lost ground on deteriorating technicals in recent weeks
after hitting a new all-time high last month. -Peter Worden
Monday, October 14, 2013

10/14/13 2:55 AM: 10/14/2013
U.S. equity futures are pointing to a lower open after Congressional leaders failed over the weekend to put together a deal to raise the country’s debt ceiling. The downturn in the futures comes after the market had one of its best weeks of the year in anticipation of the country's leaders finally reaching a deal. There is little else for investors to key in on as the lack of a deal could have a disastrous effect on the economy. The earnings season will pick up in earnest this week, offering investors a bit of distraction from the turmoil in Washington. The CBOE Volatility Index (VIX) fell another 4.5% on Friday as stocks rallied again into the end of the week. Investors poured back into equities on Thursday and Friday despite only rumors on a budget deal. ‘Risk-On’ trading already looks overdone after stocks fell sharply early in the week before the comeback late in the week. We should see some consolidation or buying of protection today if stocks remain in negative territory. Be prepared for a snap-back rally if any deal is announced or progress gets made in Washington.
Treasuries are slightly higher amid mixed overseas
markets. The 10-year Treasury yield remains just under 2.70%. Asian and
European shares are mixed, and U.S.
stocks lower as the deadlock in Washington
continued over the weekend. It appears that markets are caught between hope
that the debt ceiling will be lifted time and fear that it won't. An unexpected
fall in Chinese exports has also added some negative sentiment, despite China
rising modestly. Earnings season ramps up tomorrow and should provide a break
from the rhetoric out of DC.
Stock Stories:
Dunkin Brands (DNKN) –Yummy– The Dunkin Donuts company gets upgrade based on expansion overseas. Shares are up slightly ahead of the opening bell.
Facebook (FB) – Scoop – Social networking site buys tech start-up Onavo. The company specializes in monetizing mobile products for more content use. Facebook shares are off 1% in the premarket.
Major Economic Reports:
Columbus Day – Equities Open
7:00 pm CT – Ben Bernanke Speaks
No comments:
Post a Comment